
LIQUIDITY · ORDER FLOW · NQ / GC
Behind the CandlesHow Futures Prices Really Move
Understanding liquidity and order flow through NQ and gold.

All numerical examples and diagrams are hypothetical, not live quotes or historical trade records.
Every trade has a buyer and a seller. So why does price move?
On a chart built from trades, the last price changes when a transaction occurs at a different price. If the contracts available at one price are taken or withdrawn, the next immediate order may have to meet a different price. New orders can also change the prices available. The chart records completed trades; the order book shows the orders waiting to trade.
The article in two minutes
- Every transaction has a buyer and a seller. What matters is who accepts the available price and how much quantity is available there.
- The chart price and your execution price can differ. The last trade records a completed transaction. Your next fill depends on available counterparties and your order instructions.
- Orders can trade through several prices. Buying reaches higher offers when lower offers are exhausted without enough replenishment. Selling can reach lower bids in the same way.
- Quotes can change without a trade. Adding or cancelling orders changes what is available. The last traded price waits for another transaction to update.
- Heavy buying can produce little upward movement. Sellers may keep supplying contracts at the same price. Positive delta therefore does not guarantee a price rise.
- Triggered does not mean fully filled. Check actual executions and the remaining position, especially after a fast move.
For a quick read, follow the Key takeaway at the start of each main section and the diagrams. Section 4 follows the price change on an NQ chart and connects it to a trader's actual fills.
If you watch NQ or gold long enough, you see situations that seem contradictory. Buyers keep trading, yet price barely rises. A quiet market suddenly jumps. Your chart touches a price, but your limit order does not fill. A stop triggers, and the execution arrives somewhere else.
To understand these events, we need to look inside the auction that produces the chart. The useful questions are who is accepting a price now, how much quantity is available there, and what happens when that quantity is traded or withdrawn.
My previous guides explained the instruments behind NQ and GC. This article follows the order from the moment it enters the market to the moment it becomes a trade. We will build a small order book, walk through an NQ execution, and use a gold example to explain absorption and delta. You do not need previous experience with order flow.
I day trade NQ and GC. I stay out of major news releases, but I enjoy observing them. They make the difference between a price on a screen and an executable price especially clear.
1 Every trade has two sides
Suppose you buy three NQ contracts from someone selling three. Three contracts have traded. The exchange does not count six just because there were two sides. Volume counts the quantity exchanged once. [1]
The number of people on either side can differ. One buyer could buy ten contracts from ten sellers offering one each. Equal quantities have changed hands, even though the headcount is unequal.
This is why “there were more buyers than sellers” is an incomplete explanation of a rally. People may mean that buying was more urgent, or that desired buying exceeded what sellers were willing to supply at the old prices. Those are different claims from saying that more contracts were bought than sold.
In ordinary continuous trading, one order is already waiting. Another arrives and accepts its price. The arriving order is called the aggressor. Aggressive describes how the order executes, not the trader's emotions, experience, or position size.
A buyer who accepts a seller's offer initiates a buy. A seller who accepts a buyer's bid initiates a sell. Both transactions still have a buyer and a seller. The distinction tells us which side accepted the available terms. [2]
Imagine a seller offering a bicycle for $100. A buyer accepts $100 and the bicycle changes hands. If the next seller wants $105, the next buyer must either accept that price or wait for someone to offer less. The last agreement at $100 does not oblige anyone else to sell there.
Futures use standardized contracts and an electronic matching system, but the distinction between a completed agreement and the next available offer remains useful.
2 There is more than one market price
For the regular electronic trading discussed here, the order book records resting orders for a particular contract and expiry. NQ trades on CME and GC on COMEX, within CME Group. Both are available on the Globex electronic platform. Globex began operating on June 25, 1992. [3, 4]
An order book can be pictured as a ladder. Buy orders sit on one side, sell orders on the other, and each rung represents a price.
Four numbers deserve separate names:
- Best bid: the highest price currently displayed by a buyer willing to buy.
- Best ask or offer: the lowest price currently displayed by a seller willing to sell.
- Last traded price: the price of the latest completed transaction in that contract.
- Midpoint: the average of the best bid and best ask. It is a reference value, not necessarily an executable price.
The spread is the difference between the best ask and best bid. The quantities available at and beyond those prices make up the displayed depth. [2, 5]
In our simplified NQ book, the best bid is 25,000.00 and the best ask is 25,000.25. The spread is 0.25 index points, or one NQ tick. The midpoint is 25,000.125, which is between valid outright NQ tick prices. The last trade could be at 25,000.25 even though a seller who wants an immediate execution would currently meet the bid at 25,000.00. NQ's outright tick is 0.25 points and each point is worth $20 per contract. [6]
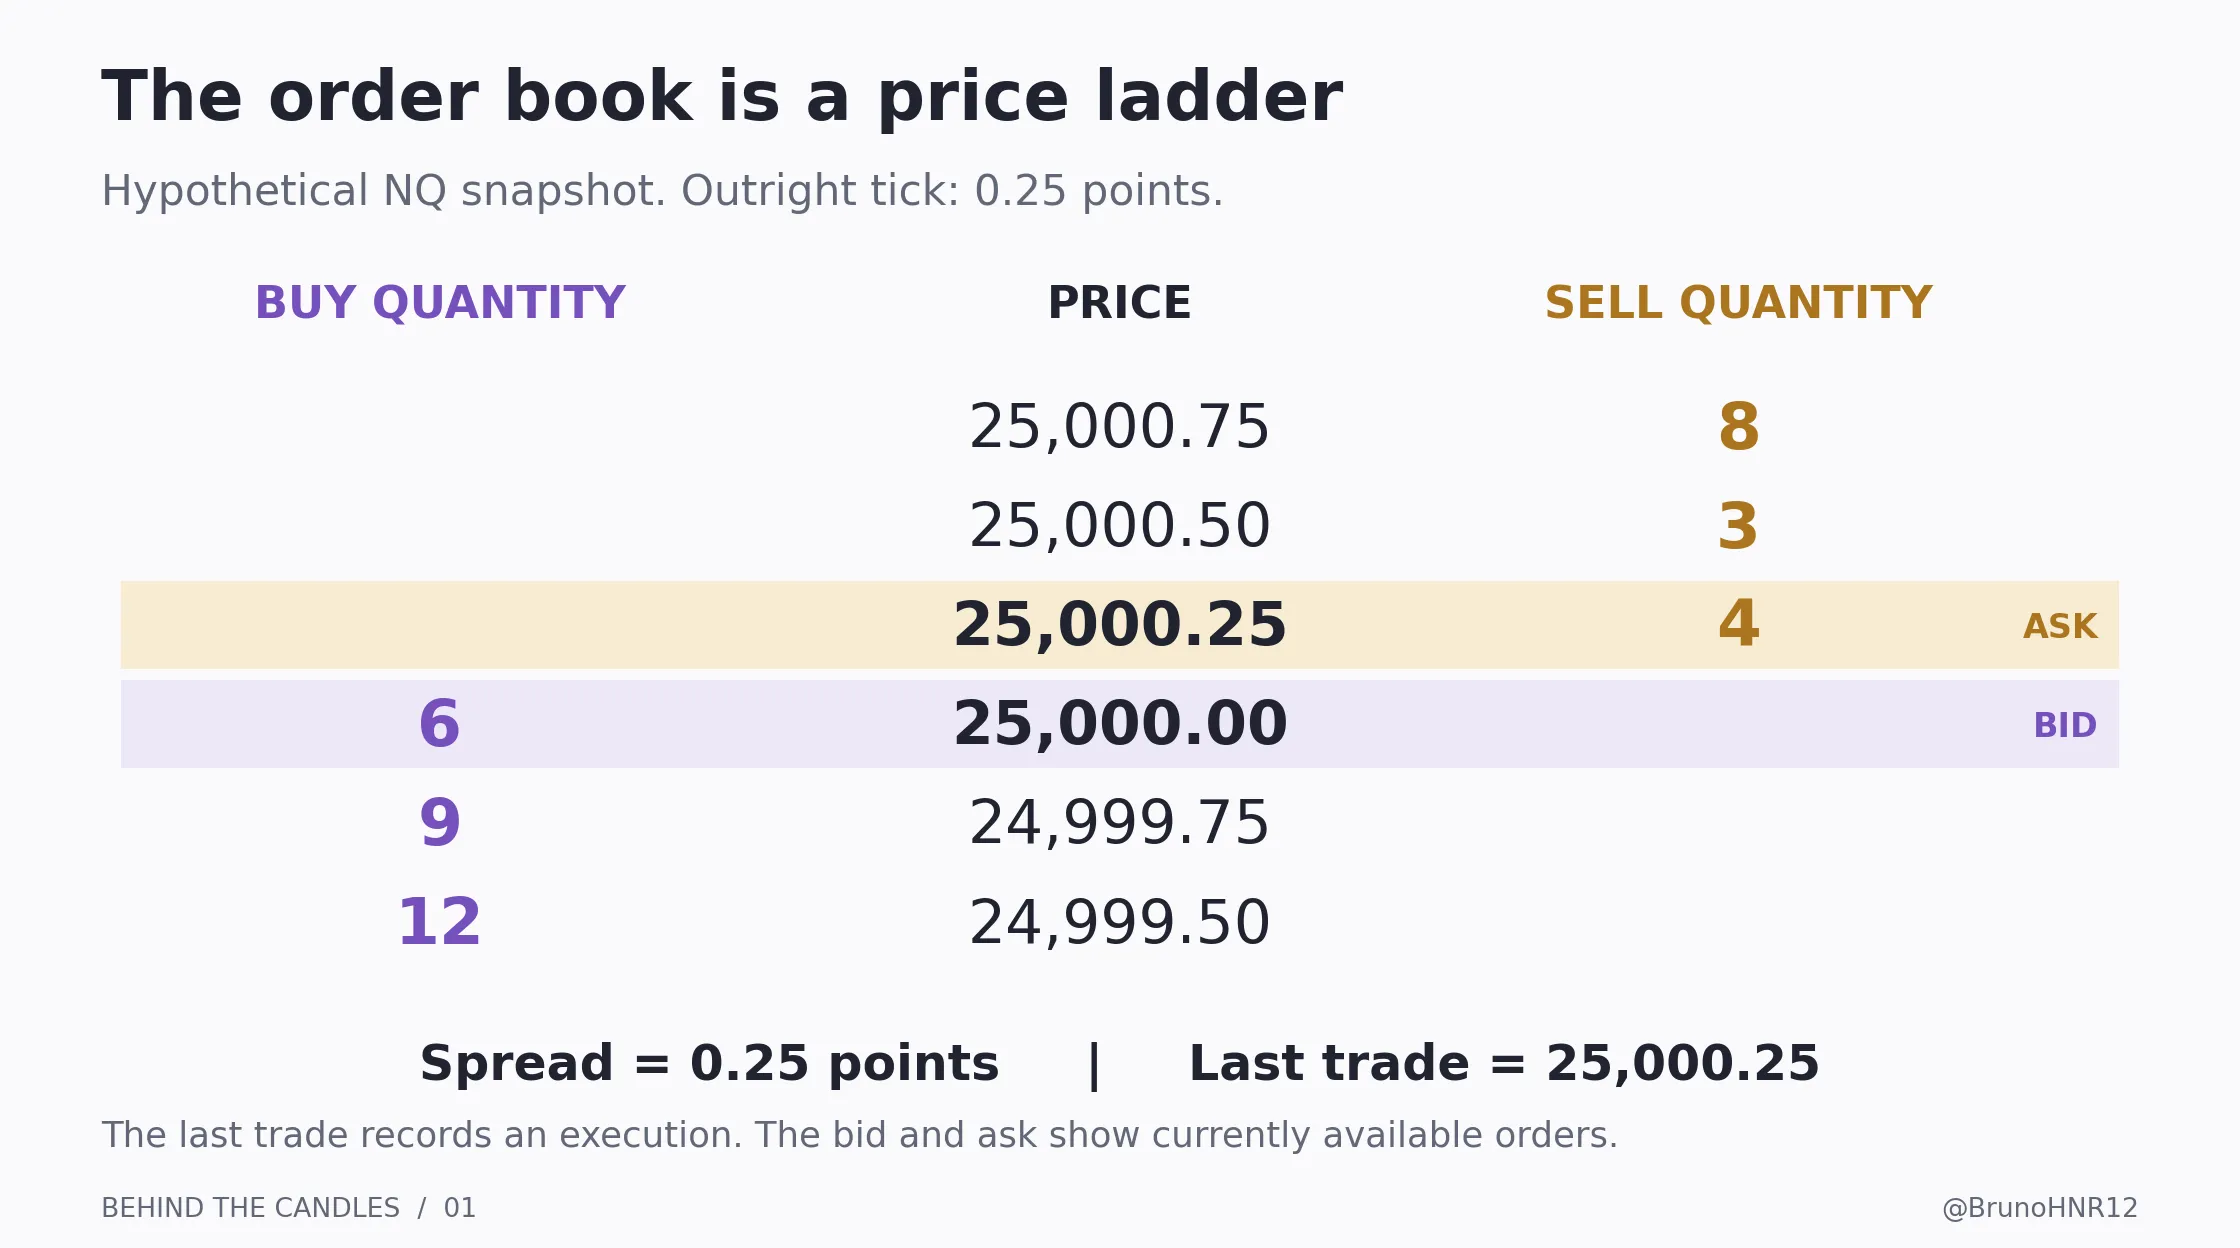
Suppose you buy one contract at the ask and immediately sell it at the unchanged bid. You lose one tick, or $5 on NQ, before fees. The midpoint did not move. Crossing the spread twice, once to enter and once to exit, produced a round-trip spread cost.
There is another subtlety. Trades can alternate between an unchanged bid and ask. A chart built from last trades may then move up and down by a tick while both quotes remain fixed. This is called bid-ask bounce. A small change in the last price does not always represent a change in the prices being quoted.
A trade-based candlestick compresses a sequence of transactions into an open, high, low and close. It does not preserve the complete sequence of orders, cancellations and executions that occurred inside it.
3 How orders enter the auction
An order contains more than a direction. It specifies a contract, a quantity, execution conditions and usually a duration. An order to buy December NQ cannot simply be matched against an order to sell a different expiry.
The first distinction to understand is between an order that waits and one that accepts liquidity already available.
A limit price controls the worst acceptable execution price
A buy limit sets the highest acceptable purchase price. A sell limit sets the lowest acceptable sale price. A limit order may execute at a better price, and it may receive no execution at all. [7]
Using our NQ book, a buy limit at 25,000.00 can wait on the bid. A buy limit at 25,000.75 can immediately execute against offers at 25,000.25, 25,000.50 and 25,000.75, if that quantity is available when the order reaches the matching engine.
The second order is a marketable limit order. It is aggressive even though its order type is “limit.” Therefore, equating every limit order with passive trading is a mistake.
For the same reason, aggressive flow is not exclusively made of orders labeled “market” on a trading platform.
Market orders seek immediate execution under exchange rules
A market order prioritizes interacting with available liquidity. Its execution still depends on the order type supported by the venue and the available counterparties.
CME Globex supports market with protection orders. They execute within a defined price range; quantity that cannot execute within it can remain as a limit order at the protection boundary. CME also documents market-limit behavior, which can leave a remainder at the first execution price. The label on your platform is not enough to identify every routing detail. [8]
We will use a marketable limit order for our main example so its maximum acceptable price is explicit.
Why touching your limit does not guarantee a fill
At the same price, orders must be allocated according to the contract's matching rules. NQ and MNQ use first in, first out, or FIFO, matching. With ordinary displayed orders at the same price, earlier orders have priority. Other CME products can use different matching algorithms. [9, 10]
Imagine that 40 contracts are ahead of your one-contract NQ buy order at 25,000.00. If only 12 sell-initiated contracts execute there, your order can remain unfilled. A print at your price shows that someone traded there. It does not show that enough quantity reached your place in the queue.
This is a simplified queue example. New events, cancellations and order modifications change the actual queue. When reviewing a missed fill, first check the precise contract, timestamps, execution reports and data feed.
4 Why the price changes on your NQ chart
Now send an order to buy ten NQ contracts with a limit of 25,000.75. Assume the following offers are available when the order reaches the matching engine:
- Four contracts at 25,000.25.
- Three contracts at 25,000.50.
- Eight contracts at 25,000.75.
For this illustration, there are no hidden quantities or other book changes during the match. The order buys four at the first price, three at the second, and three at the third. Five of the eight contracts at 25,000.75 remain offered.
This is often called sweeping the book: one incoming order executes against several price levels. Ten contracts were bought and ten were sold. The higher last price resulted from executions reaching higher offers.
Why the displayed price changes
The execution prices progress from 25,000.25 to 25,000.50, then to 25,000.75. A chart built from last trades follows those transactions. The available contracts at each of the first two prices were exhausted, and the remaining buy quantity met higher offers.
For a downward move, reverse the example: aggressive selling can exhaust the available bids and execute at successively lower prices. In both directions, the quantities available and the order in which events occur matter.
Why your average fill can differ
The average fill is calculated by weighting each execution price by its quantity:
Average fill = (4 × 25,000.25 + 3 × 25,000.50 + 3 × 25,000.75) ÷ 10 = 25,000.475.
An average price can fall between ticks even though every individual fill occurs on a valid tick.
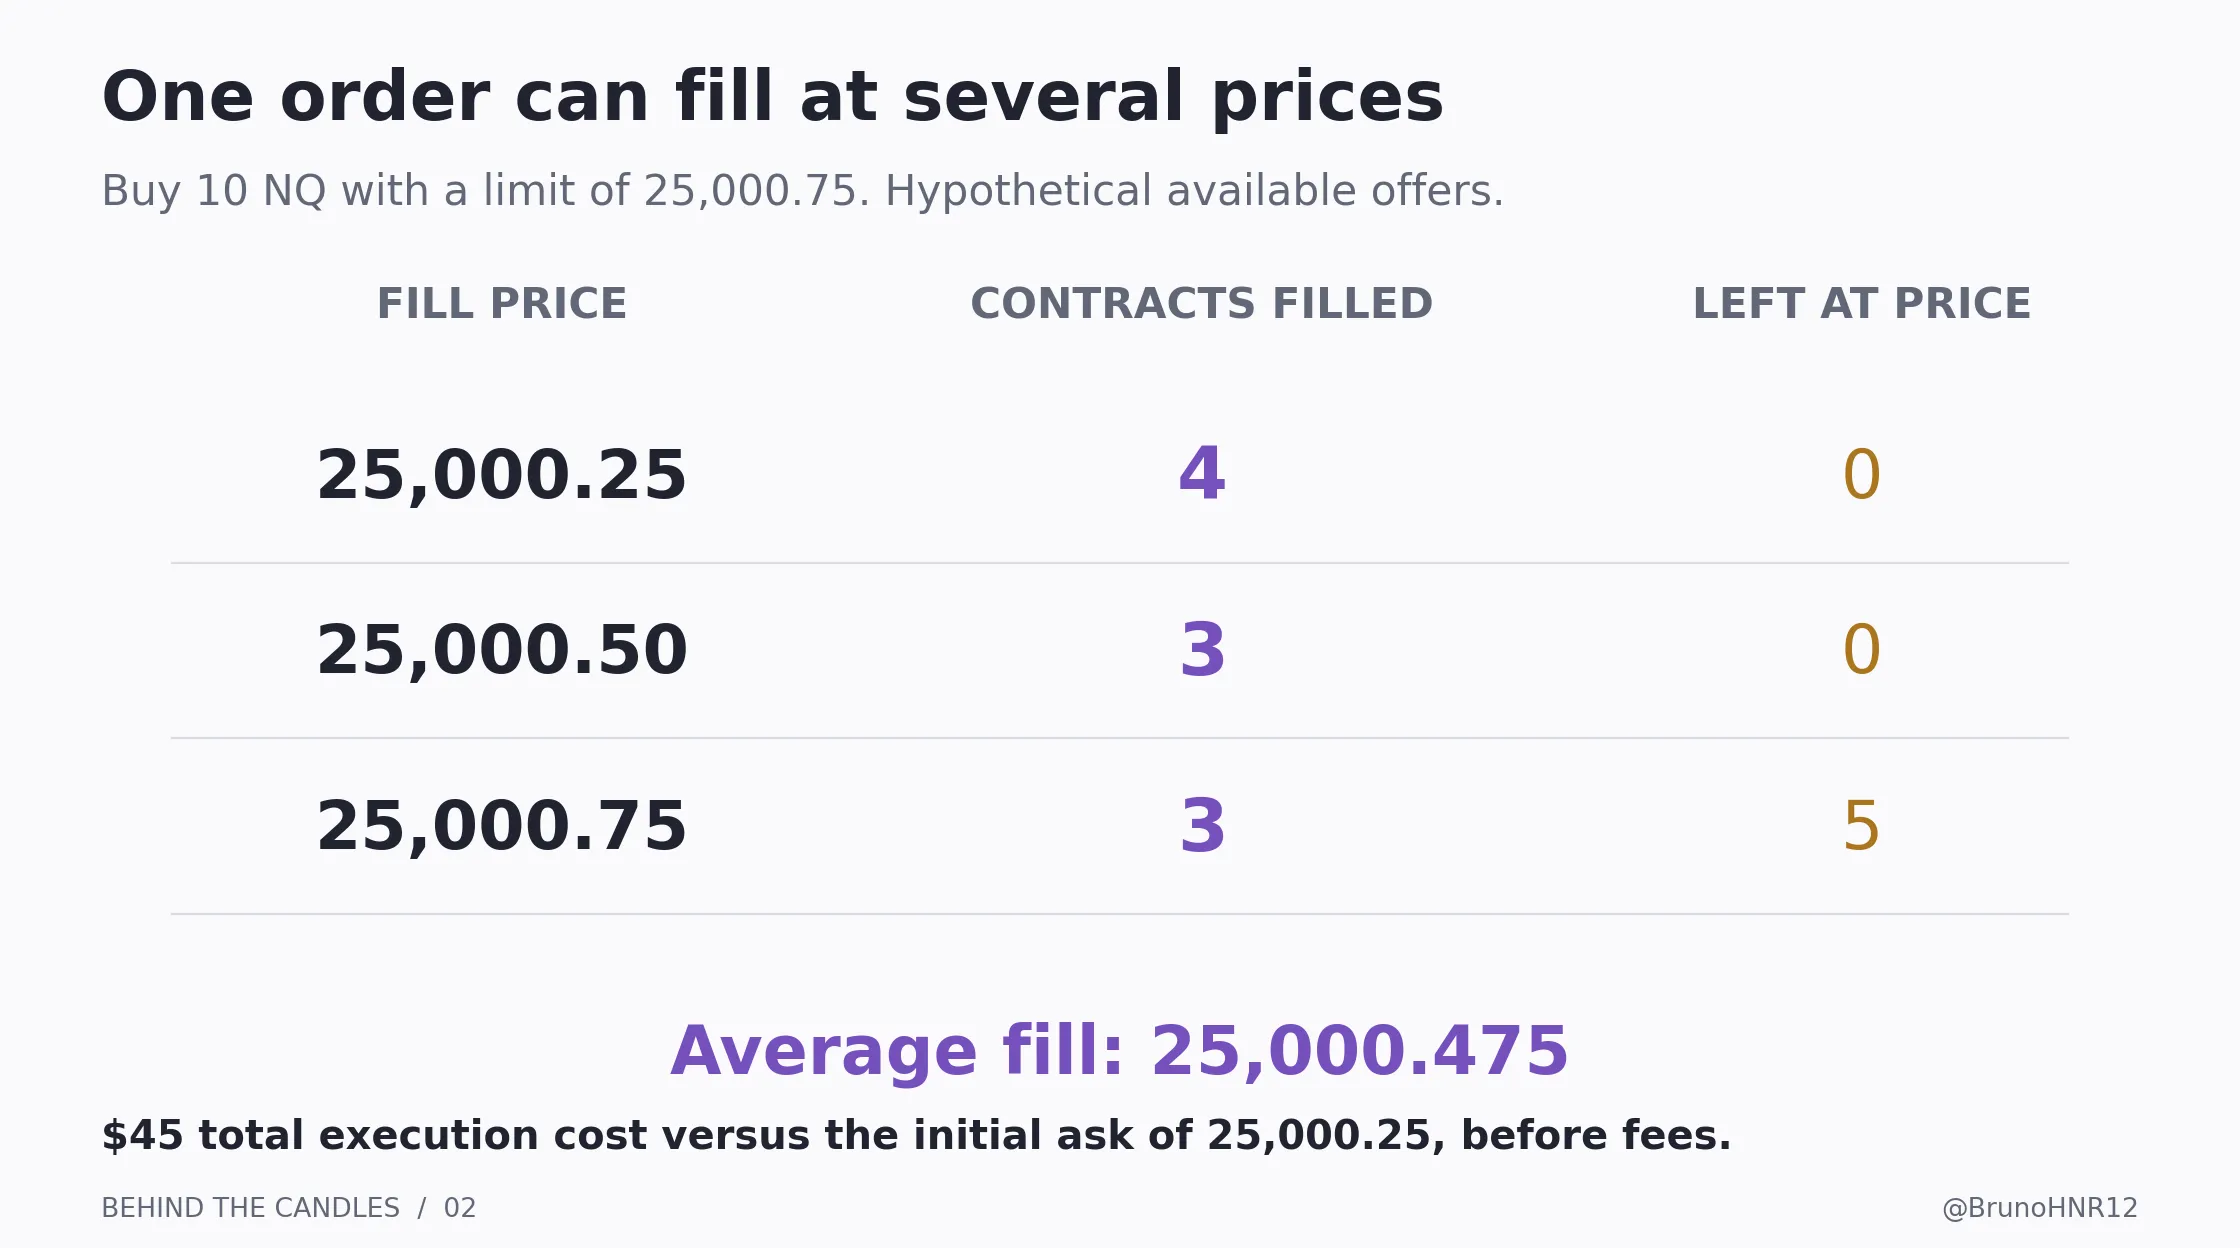
If your benchmark was the initial best ask of 25,000.25, the average execution is 0.225 points worse. At $20 per point, that is $4.50 per contract, or $45 across ten contracts, before commissions and exchange fees.
This comparison defines the benchmark explicitly. If you compare your fill with the previous last price, the midpoint, or the price at the moment you clicked, you will obtain a different slippage number. Record the benchmark before judging the execution.
The chart finishes with a last trade at 25,000.75. That is not the average price the buyer paid. A screenshot showing only the final price conceals the distribution of fills.
If 100 contracts had instead been available at the initial ask, this ten-contract order could have filled entirely at 25,000.25. Its direction and quantity would be identical, but its immediate effect on the last price would differ.
This comparison illustrates why there is no fixed conversion such as “100 buys equal five NQ points.” The book available to those orders matters. CME's liquidity methodology explicitly measures the cost of trading a chosen quantity across successive levels when the best price does not contain enough size. [5]
What the price change means for your own trade
Suppose you bought one NQ contract at 25,000.25 and later sold it at 25,000.75. Your actual executions are 0.50 points apart. At $20 per point, that is $10 of gross profit before fees. Reversing those entry and exit prices would produce a $10 gross loss for the same long trade. [6]
A last trade at 25,000.75 does not guarantee you can sell at that price. Your sell order still needs an available buyer at a price allowed by your instructions. Keep three values separate: the last trade on the chart, your average entry, and your actual exit.
5 Quotes can move without a new trade
Executing against a resting order is one way to remove quantity. Cancelling it is another. New orders can also improve the best bid or ask. The book evolves through all three processes. [5]
Return to our original NQ snapshot. The best ask is 25,000.25, with another offer at 25,000.50 and one at 25,000.75. Suppose the first two offer levels are entirely cancelled before anyone trades against them.
The new best ask is 25,000.75. If the bid stays at 25,000.00, the spread widens from 0.25 to 0.75 points. The last traded price remains unchanged because no new trade occurred.
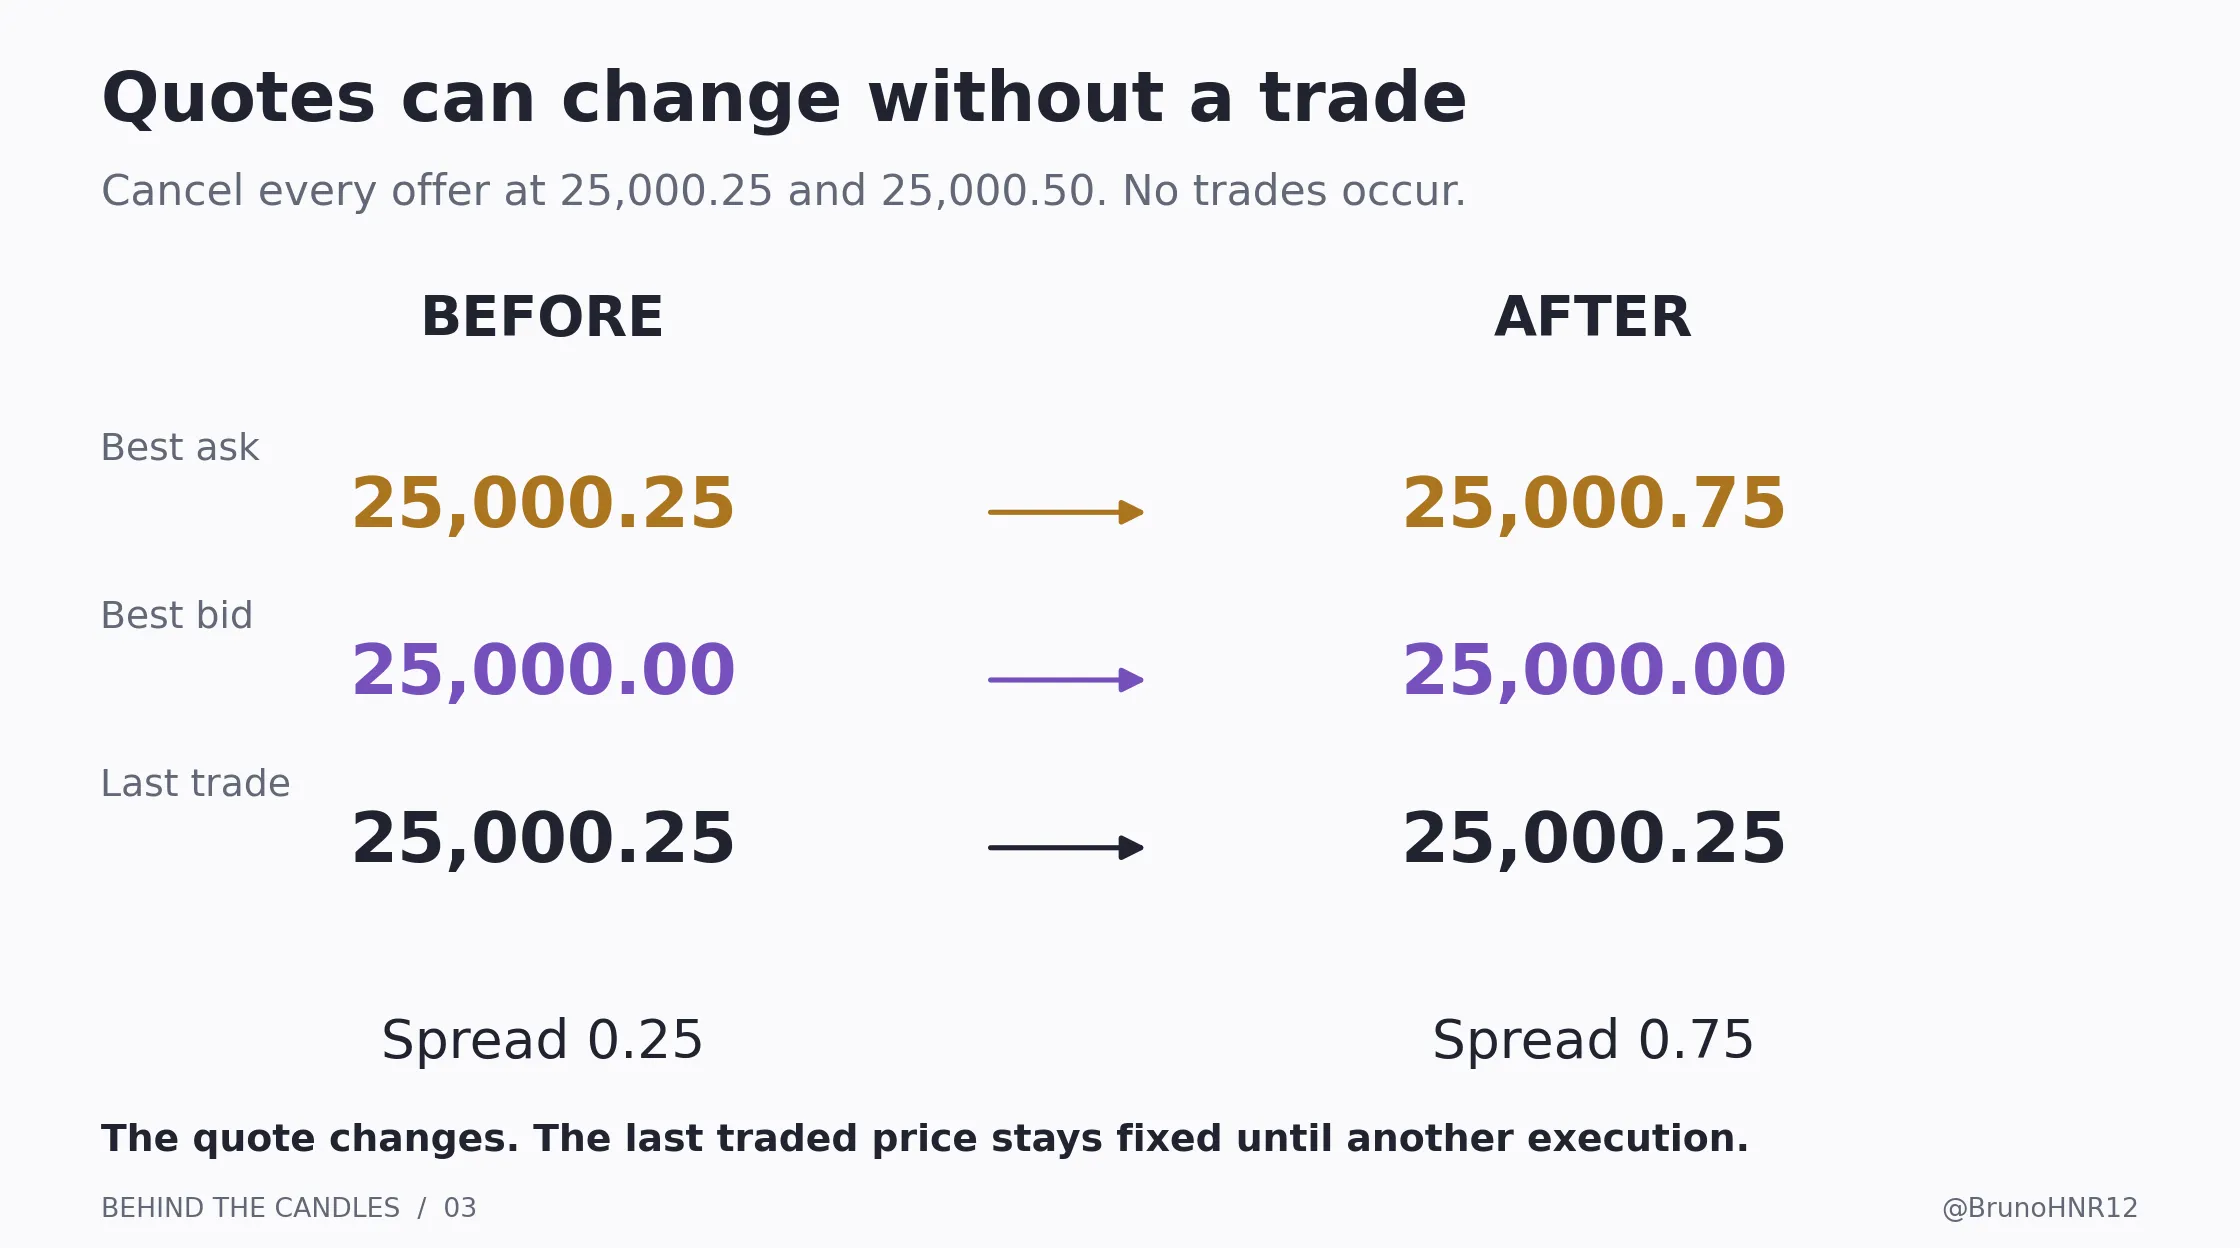
This distinction matters when someone says that price moved “without volume.” Which price moved? A quote can change with zero executed volume. A trade-based last price needs a new transaction to update, but that transaction can be small after nearby liquidity has disappeared.
Researchers Cont, Kukanov and Stoikov studied limit orders, market orders and cancellations in 50 US stocks. Their results linked short-term price changes more closely to an order-book imbalance measure than to traded volume alone. That study concerns stocks and a specific dataset; it is not a ready-made NQ or GC forecasting model. It supports examining more than executions when explaining how a book changes. [11]
Liquidity has several dimensions
For a trader, liquidity is the ability to transact a chosen size promptly at a reasonable execution cost. Look at several things together: the spread, available quantity across prices, and how quickly new orders replace quantity that trades or disappears. A narrow spread with one contract available offers a different execution environment from the same spread with substantial size. [12]
The ability of the book to recover after an order consumes liquidity is often called resilience. A snapshot may look thin while fresh orders arrive quickly. A snapshot may also look deep moments before its orders are cancelled. Displayed depth is current information, not a reservation made for your future order. [13]
Large daily volume cannot settle the question of what your next order will cost. The relevant conditions are those present when that particular order reaches the market.
The May 6, 2010 Flash Crash provides a historical example. The joint CFTC-SEC report described heavy trading alongside deteriorating liquidity in E-mini S&P 500 futures. Repeated transactions between intermediaries generated substantial volume without equivalent lasting absorption by investors. The report explicitly cautioned against treating high volume as a reliable liquidity indicator during severe volatility. This was a complex event, not a claim that every rapid move has the same cause. [14]
6 Absorption and the gold that keeps trading at one price
Suppose GC is offered at 4,000.0. Buyers repeatedly accept that price, yet trades do not advance to 4,000.1.
Traders often call this sell-side absorption: aggressive buying is meeting enough passive selling to limit upward progress during the interval being observed. The mirror case is passive buyers absorbing aggressive selling.
The label describes an interaction. It does not identify the seller or tell you how long that seller will continue. A large visible order, multiple independent sellers, newly submitted orders, or an iceberg can produce similar broad effects. [15]
An iceberg order displays only part of its total quantity. As the displayed portion trades, another portion can become visible. CME provides a display-quantity facility; externally managed systems can also submit successive smaller orders. [16, 17]
Here is a hypothetical native iceberg sell order: 100 GC contracts at 4,000.0, displaying ten at a time. Eight successive buy orders of ten contracts each trade against it. Eighty contracts have executed at 4,000.0, although a snapshot may repeatedly show only ten available. Twenty contracts remain in the total order.
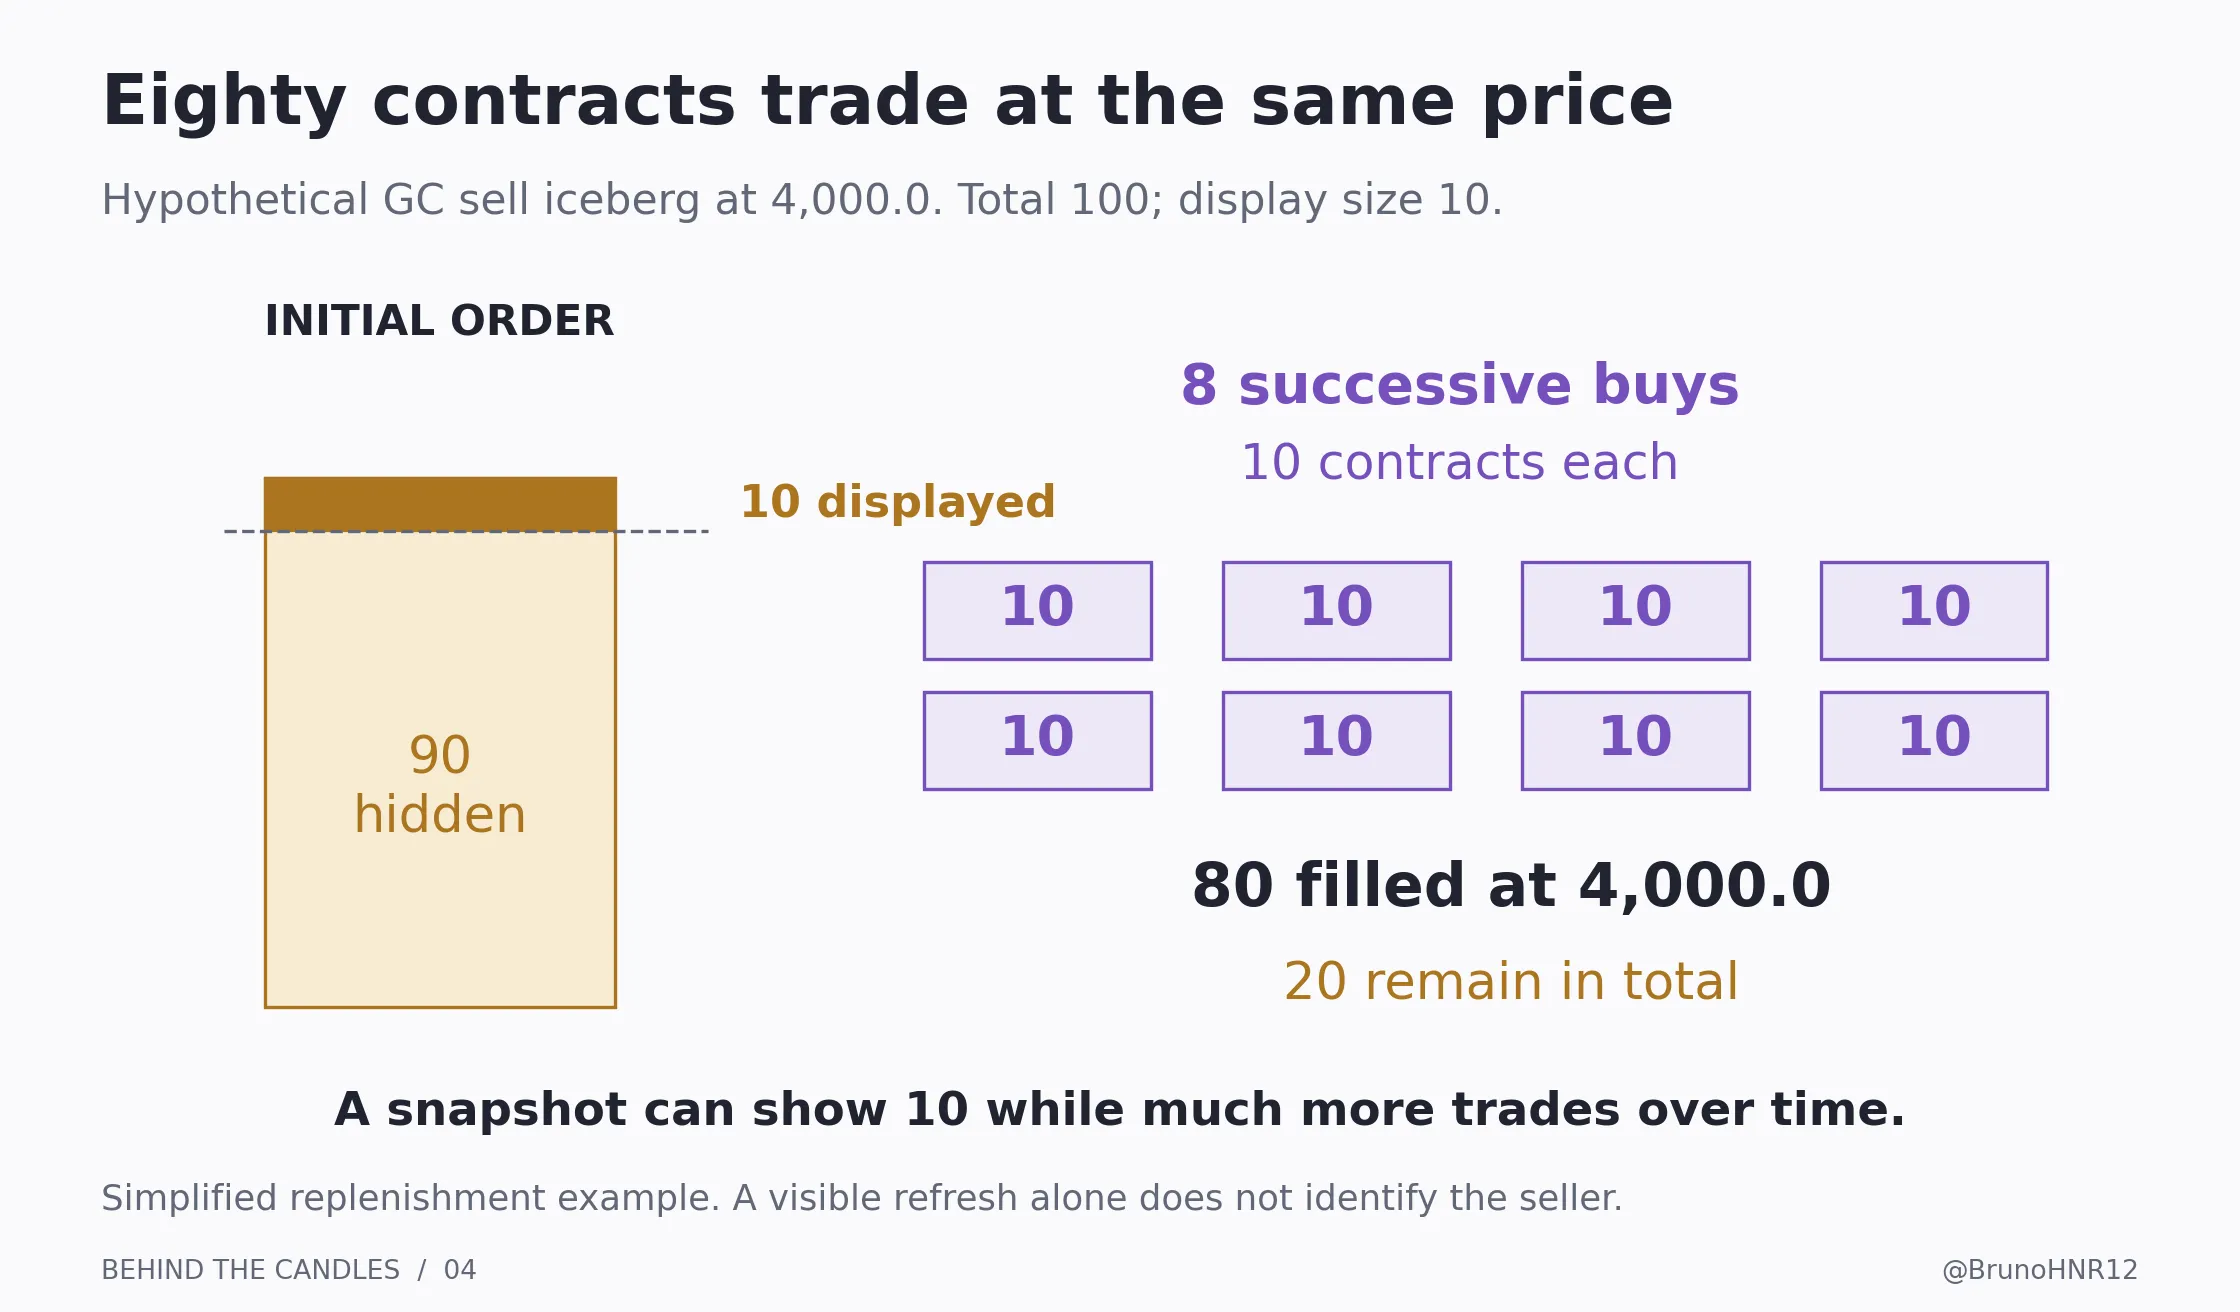
A static screenshot cannot reveal that entire sequence. Even an iceberg detection tool depends on the available data and its tracking method. Repeated replenishment in an aggregated book is evidence to investigate, not proof of one particular trader's total hidden size. [15]
What can happen next in our example?
- More buyers may trade through the remaining twenty contracts and reach higher offers.
- The seller may cancel the remainder. A later buyer can then meet a higher offer with less quantity traded at 4,000.0.
- Buying may slow, while sellers begin accepting lower bids.
All three paths are compatible with the earlier observation of absorption. The observation alone cannot choose among them.
Calling the level “defended by institutions” adds two claims: an identity and an intention. Neither is supplied by ordinary anonymous order-book data. A more accurate description is that repeated buy-initiated volume executed there with limited upward progress.
A displayed wall is not a promise
A large order can be genuine and still be cancelled after circumstances change. Cancellation alone does not establish spoofing.
CME Rule 575 prohibits entering orders with prohibited intent, including the intent at entry to cancel before execution, and misleading or disruptive messaging. Its guidance also explicitly allows an initially bona fide order to be changed or cancelled when circumstances change. The advisory in force at this article's check date became effective August 13, 2026. [18]
A chart or heatmap may show an order appearing and disappearing. Determining a rule violation requires more evidence about the conduct and intent than that picture supplies.
7 What volume and delta actually measure
Three terms are frequently mixed together:
- Volume measures the quantity traded during a selected period.
- Displayed depth measures resting quantity visible at a moment in time.
- Volume delta compares buy-initiated and sell-initiated executed quantity during a selected period.
In a common footprint convention, trades at the ask count as buy-initiated volume and trades at the bid count as sell-initiated volume. Platforms may use exchange aggressor information or classification rules, so check the implementation. CME's trade-summary messages include an aggressor-side field and allow cases without an identified aggressor. [19, 20]
For the fully classified examples in this article:
Volume delta = buy-initiated contracts − sell-initiated contracts.
Suppose 80 contracts trade through buy-initiated executions and 20 through sell-initiated executions. Total volume is 100 contracts and delta is +60.
There were still 100 contracts bought and 100 sold. Delta classified the initiator of each execution; it did not erase the passive counterparty. It is also different from options delta, which describes an option's sensitivity to its underlying price.
Positive delta can accompany a lower price
Continue the GC example. First, buyers execute 80 contracts at 4,000.0 against the replenishing offer. They fail to lift the next price. Then sell-initiated orders execute five contracts at each of 3,999.9, 3,999.8, 3,999.7 and 3,999.6. Assume these bids are not replenished before the selling reaches the next level.
For the complete sequence, delta is still +60. Yet the last trade has moved from 4,000.0 to 3,999.6.
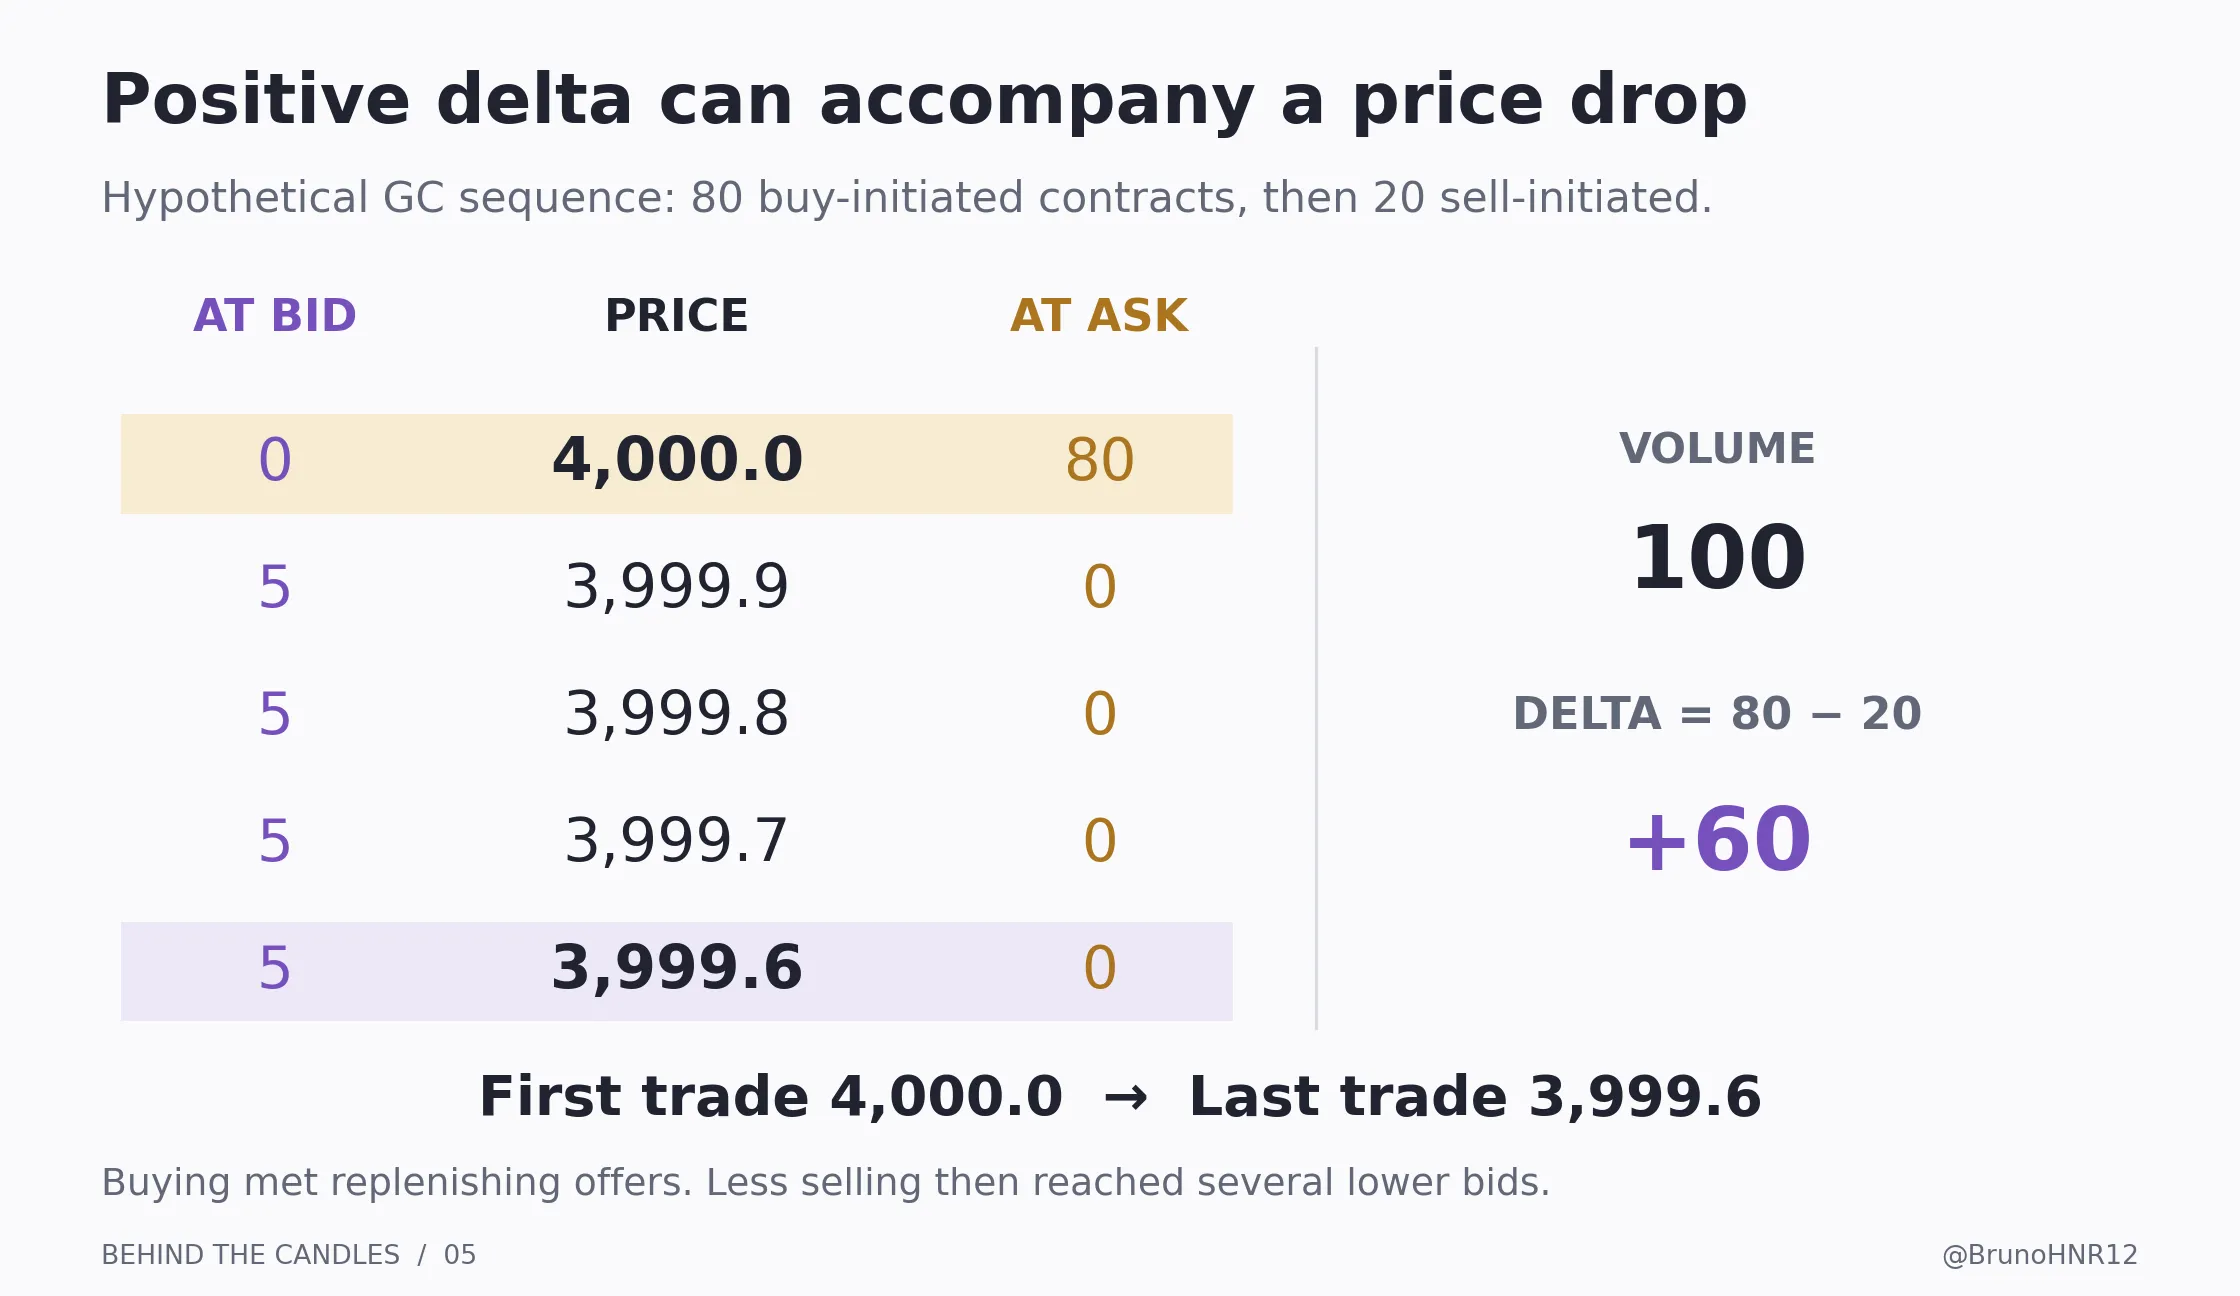
There is no contradiction. Buying met substantial supply at one price. A smaller quantity of aggressive selling subsequently reached several lower bids. The time order of events and the depth on each side determined the result.
If your footprint combines the entire sequence into one bar, the positive total conceals those phases. A finer view may reveal them, but it still cannot tell you what orders will arrive next.
Cumulative delta depends on where you start counting
Cumulative volume delta, or CVD, adds successive volume deltas from a chosen starting point. A session reset, a different historical start date, a volume filter or a different data feed can change the displayed result. Sierra Chart's documentation describes these calculation and historical-data dependencies. [21]
A rising CVD means the chosen calculation has accumulated more buy-initiated than sell-initiated volume. It does not measure dollars entering the market, identify investors, or prove that new long positions were opened. A buyer can be closing a short; a seller can be closing a long.
To interpret a disagreement between price and CVD, compare the same contract, the same time interval and the same settings. Then inspect how transactions interacted with available liquidity. Treat the disagreement as a question about the sequence, not an automatic reversal signal.
8 Stops are conditional orders
An untriggered stop is not the same thing as a resting limit order displayed in the public book. Native CME stops wait for their triggering condition. Broker-held or platform-held conditional orders may have different hosting and trigger arrangements. Your broker's documentation determines which behavior applies to your order. [7, 8]
The distinction becomes important when traders say there is “liquidity above the high.” They may mean that buy stops are expected there. Once activated, aggressive buy orders demand sell liquidity. Before activation, those stops are not visible resting offers available to fill someone else's buy.
The word liquidity is being used in two different senses: displayed orders available now, and anticipated future order flow. Keeping those meanings separate makes the explanation clearer.
How a stop cascade can develop
Imagine NQ trading up to a prior high. Some traders may have conditional buys above it: short positions using protective stops, or traders entering on a breakout. Their exact locations and quantities are generally unknown to someone observing the public book.
If trades reach the triggers, some of those orders activate. If the resulting aggressive buying encounters limited offers, executions can reach higher prices and activate additional stops. That feedback can accelerate a move. It can also stop when sufficient offers meet the buying or when the triggered demand is exhausted.
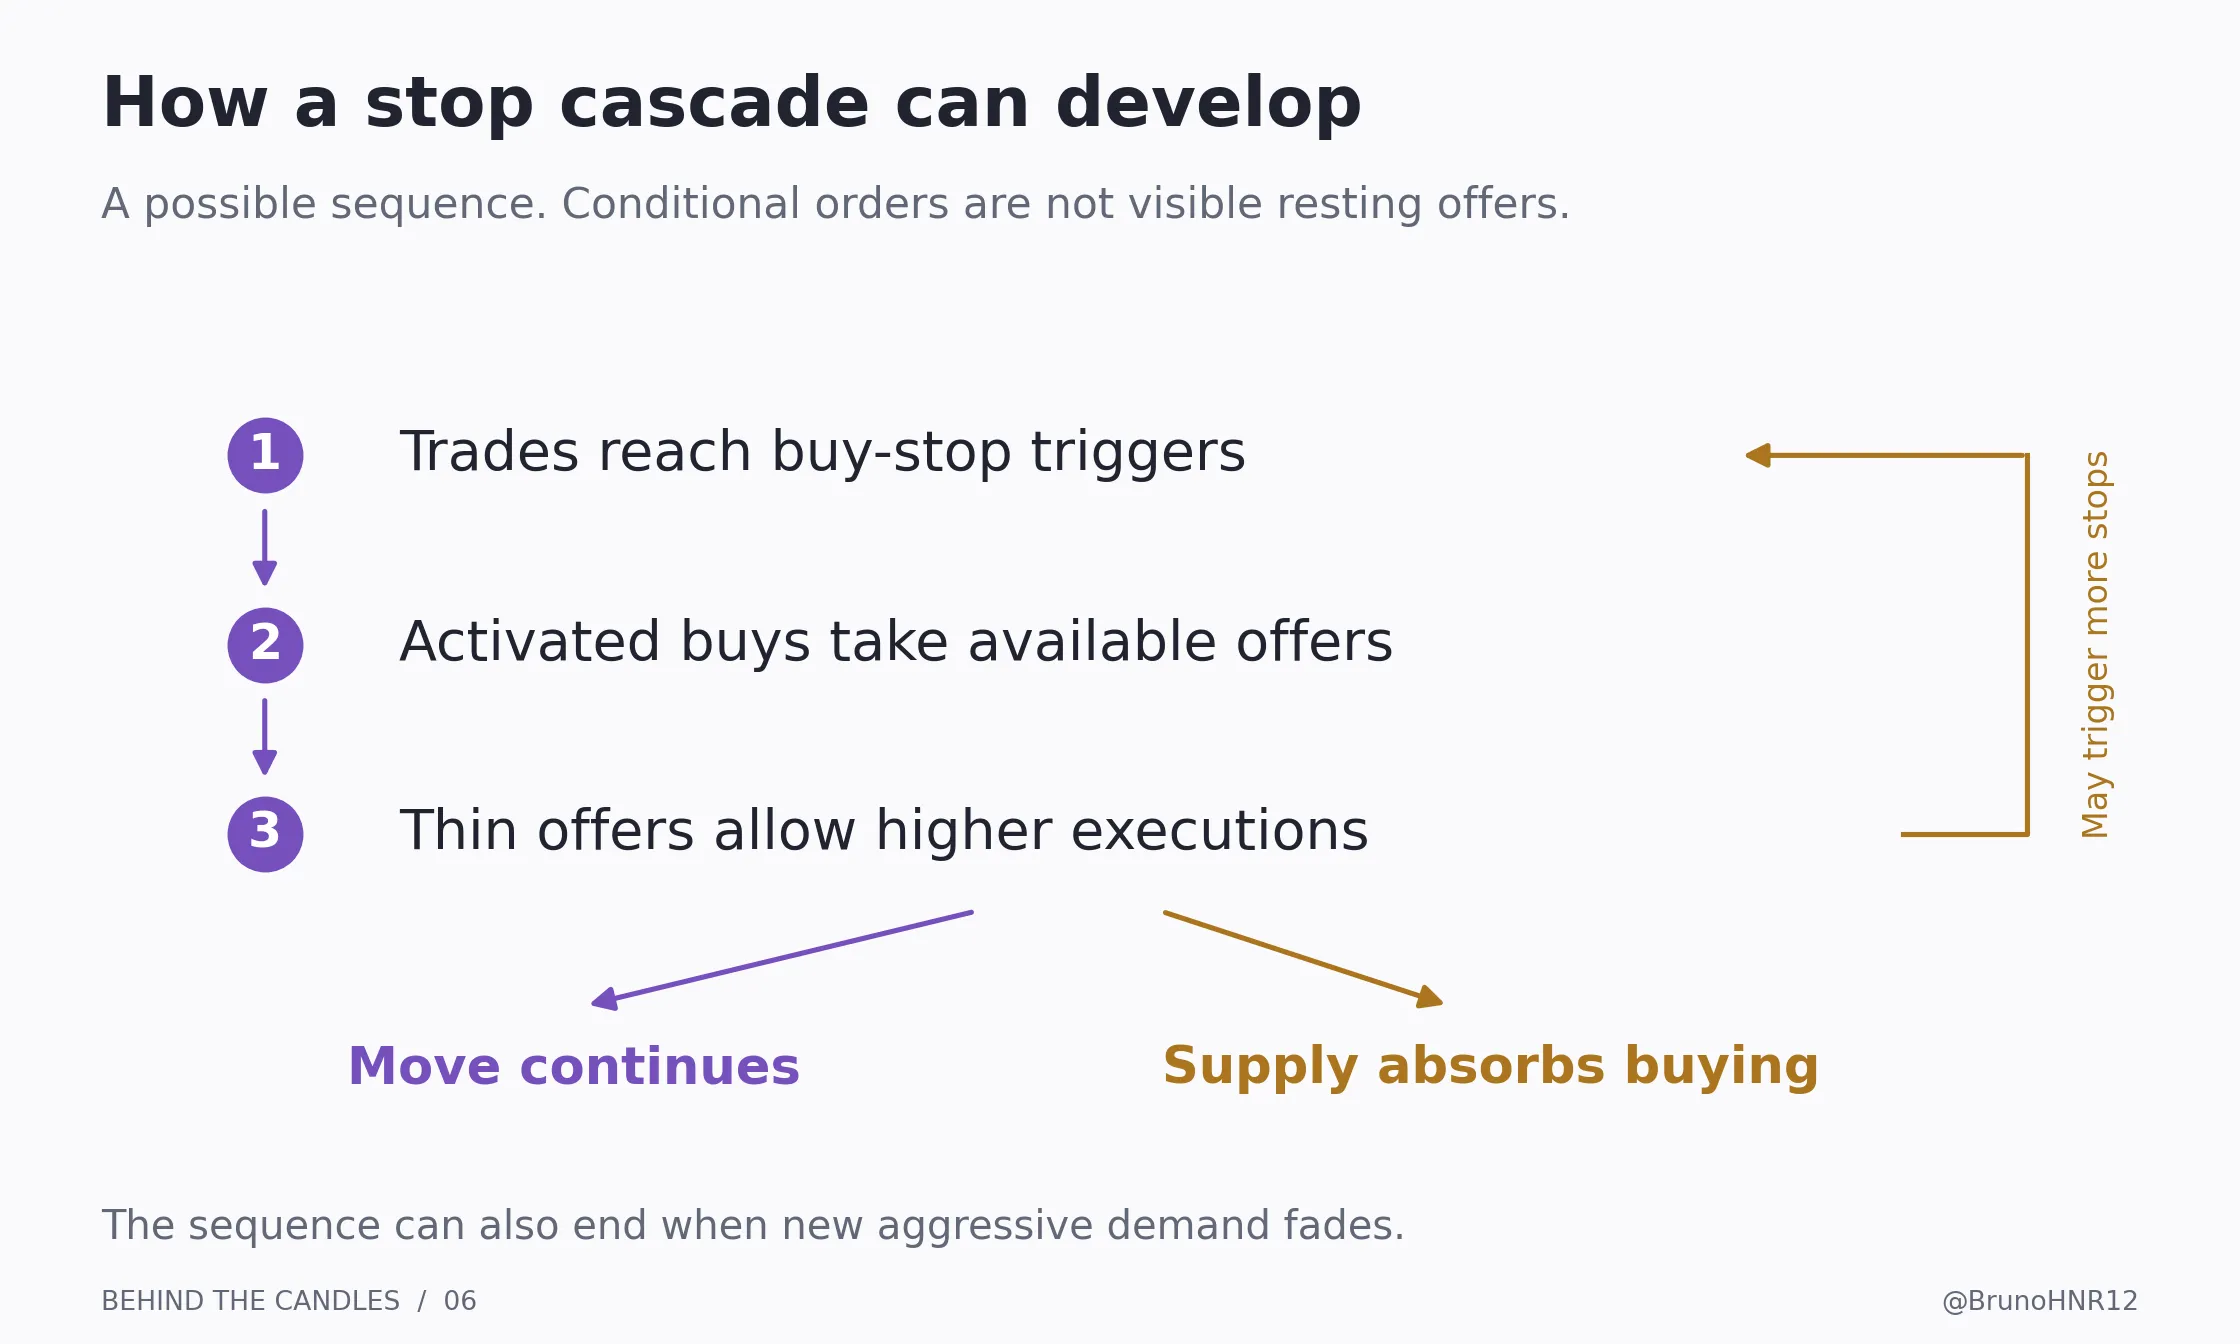
This is a possible mechanism for a fast breakout. A wick beyond a prior high followed by a reversal does not establish that someone deliberately targeted retail stops. The candlestick does not reveal the necessary identities, complete conditional order inventory or intent.
A trigger is not a guaranteed exit price
A stop-limit activates a limit order. If its price is no longer executable, it can remain unfilled.
A native CME stop with protection can trade within its protection range. Any unexecuted remainder is placed at the protection boundary as a limit order. It can therefore leave part of the intended exit outstanding. Protection limits execution prices under that order's rules; it does not guarantee that the entire position is closed. [8]
For example, suppose you are long three contracts and a sell stop for all three triggers. Two execute within the permitted range. If the remaining one cannot, it can rest at the protection boundary while you remain long one contract. The order is triggered and partially filled, but your position is not flat.
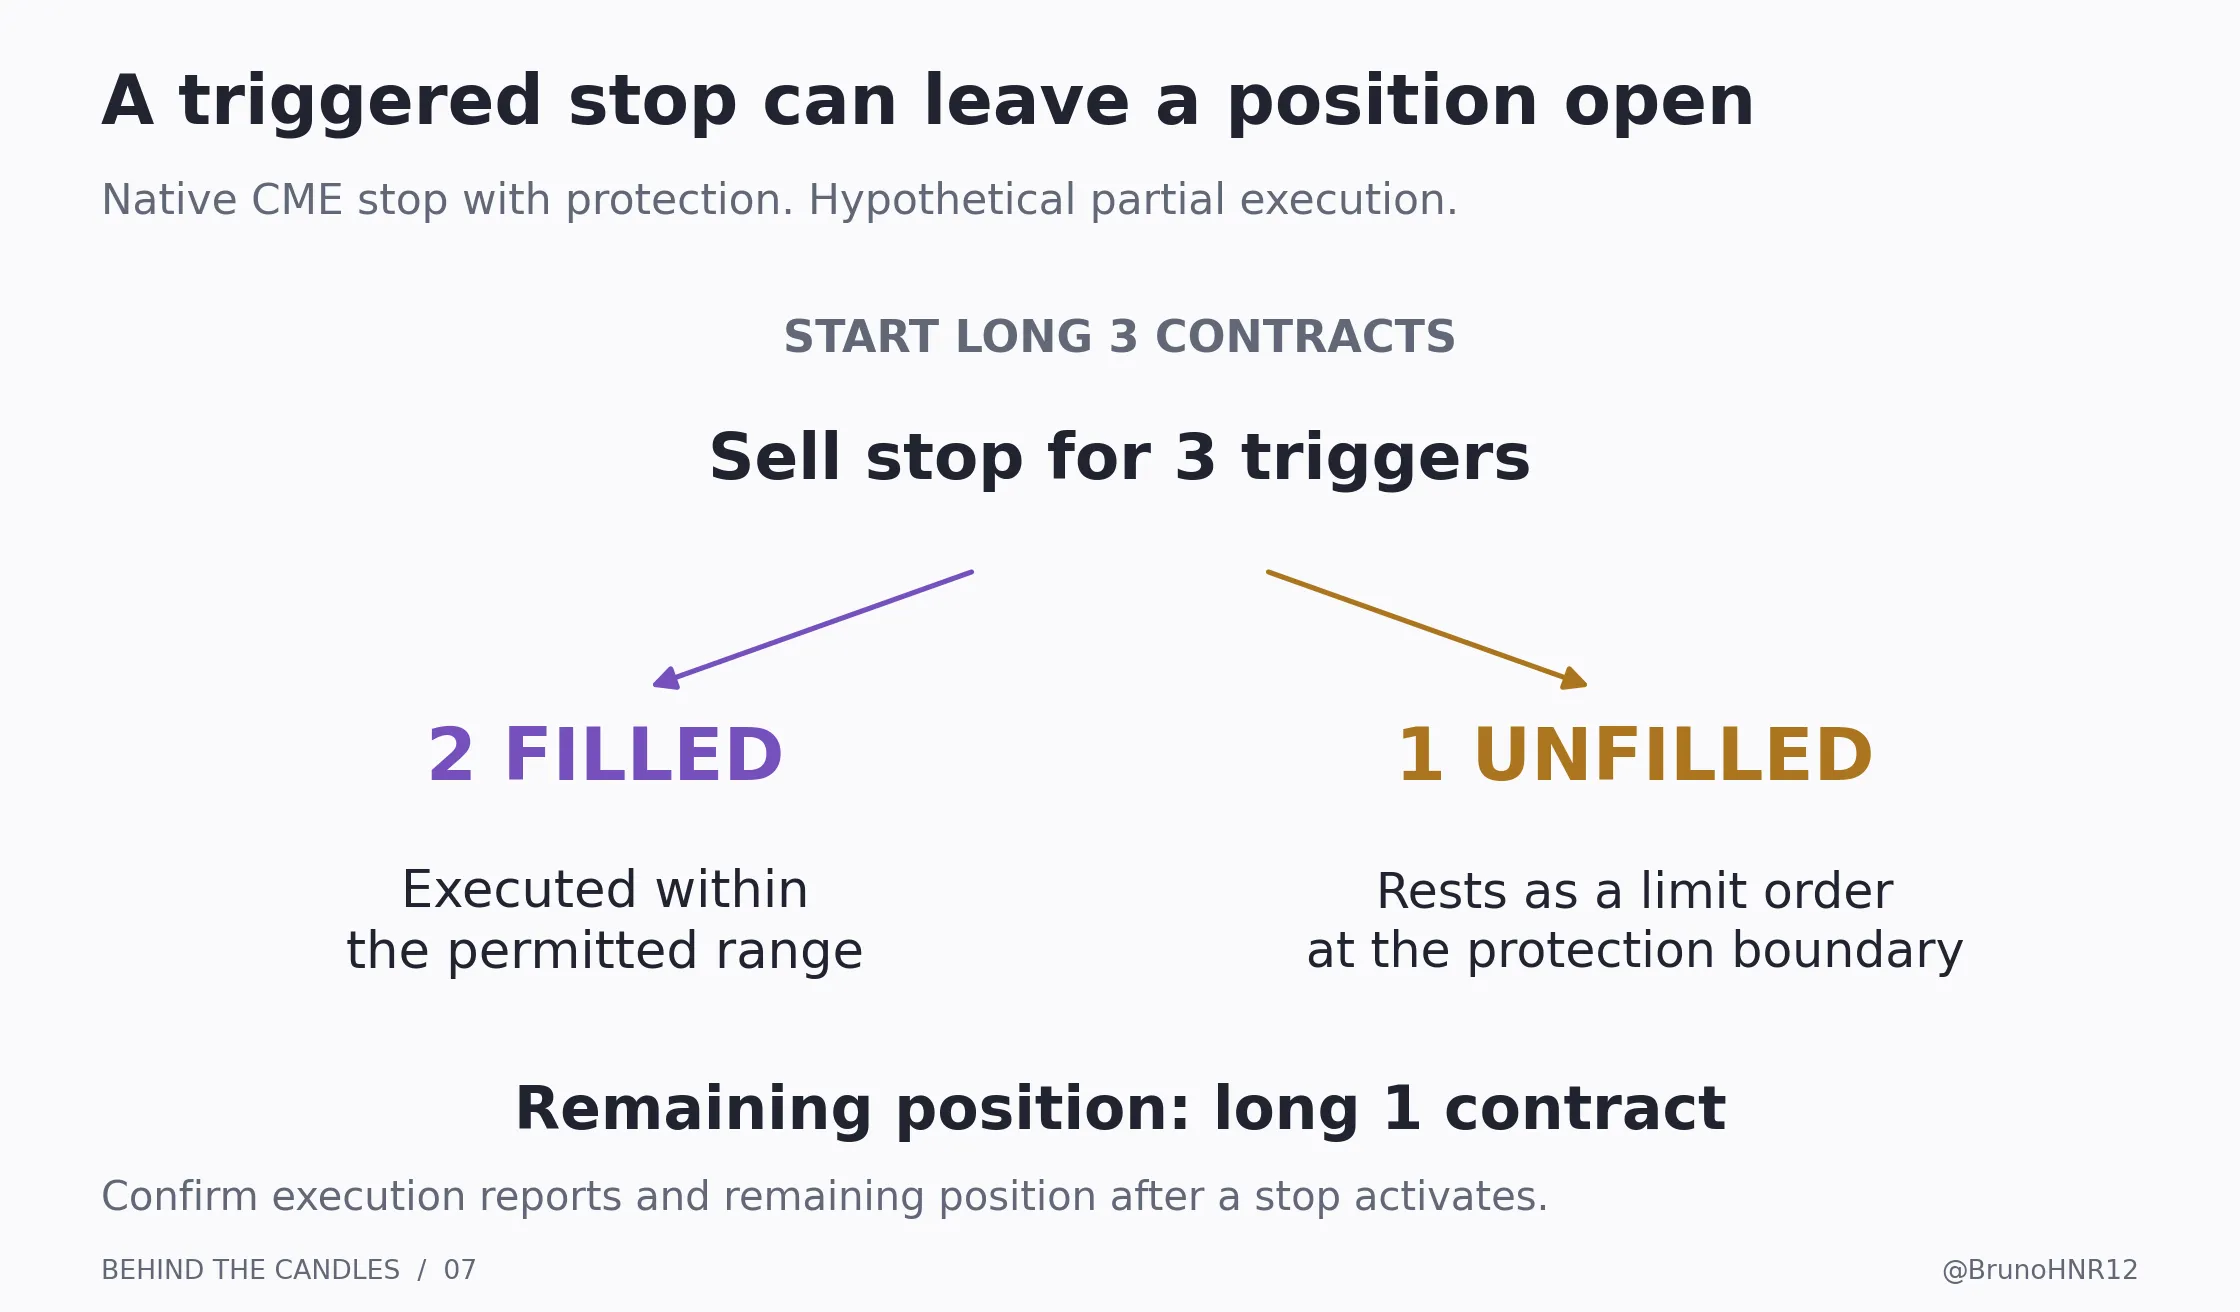
Consider a separate hypothetical GC stop-limit example. A trader is long and uses a sell trigger at 3,999.0 with a limit at 3,998.5. The trigger trades, but before the order can finish, available bids are all below 3,998.5. Its remaining quantity cannot be sold at those lower prices under the limit instruction. The trader still has that remaining exposure.
For a day trader, knowing the hosting, trigger, protection and remainder behavior of a stop is as fundamental as knowing the tick value. Review actual execution and order-status reports after an abnormal move. A chart marking the stop level does not confirm a complete exit.
9 What the tools show and what they leave out
Order-flow tools arrange market data into different views. Each view answers a particular question. More colors and columns do not automatically provide more reliable conclusions.
Candlesticks
Candles make price structure easy to scan. They compress information: two intervals can have the same open, high, low and close while visiting those prices in different orders. Volume, when shown separately, still cannot reconstruct the full sequence.
Time and sales
Time and sales lists reported executions with their prices, quantities and timestamps. It helps investigate what actually traded. A print size is not necessarily the total size of one trader's parent order. One order can generate several fills; a display can also aggregate information.
CME's trade messages distinguish prices, quantities, participating orders and aggressor information. Details such as spread-leg volume reporting also mean that an outright trade-summary view and a broader volume total need not contain identical information. [20]
The DOM and heatmap
The depth of market, or DOM, displays quantities around the current market. A heatmap records displayed liquidity over time. These views help show whether orders persist, move, trade or disappear, within the limits of the feed and display.
Market by Price, or MBP, groups quantity at each price. Market by Order, or MBO, provides anonymous order-level detail that can support queue analysis. MBO does not reveal customer or firm identity, and your platform may expose less information than the underlying exchange feed offers. [17]
An impressive bright band on a heatmap may never execute if its orders are withdrawn. To study interaction, compare displayed quantity with subsequent trades and changes in the book.
Footprints and volume profiles
A footprint places executed quantities at individual price levels inside a bar, often splitting bid-side and ask-side volume. It helps compare trading activity with price progress. Classification, aggregation and bar settings affect its appearance. [19]
A volume profile groups past executed volume by price over a chosen interval. A high-volume area shows where considerable trading occurred. It does not prove that the same participants still hold positions or that resting orders remain there today.
A DOM answers a question about displayed orders now. A profile answers a question about transactions during a past interval. Treating a historical high-volume area as a measured current liquidity wall confuses those two datasets.
Data quality comes before interpretation
Check whether your subscription includes live depth, how many levels are delivered, whether historical bid/ask volume is available, and whether the display aggregates or filters trades. Dropped events, limited historical data or different session boundaries can materially change an order-flow reconstruction. [15, 21]
You cannot recover the original tick-by-tick order sequence from five-minute OHLC bars. Nor can a screenshot establish how an order evolved before and after the captured moment. If the evidence is missing, the explanation must remain conditional.
10 NQ and GC are connected to wider markets
The order book explains the immediate execution mechanism. It does not contain every economic reason for the orders.
An NQ participant may react to a change in the outlook for its underlying companies, equity valuations or interest rates. A gold participant may react to monetary expectations, currency movements, physical demand or portfolio hedging. Related cash, futures, options and other markets can transmit information through participants trading across them. The earlier instrument guides cover those connections in more detail. [22, 23]
For the purpose of this article, the bridge is straightforward: new information changes prices participants are willing to quote and quantities they are willing to trade. Those changed decisions reach the futures market through submitted, modified, cancelled and executed orders.
There does not need to be an immediately visible headline behind every short-term movement. Position management, a large execution or a change in available liquidity can alter the next trades. An anonymous execution does not disclose which explanation applies.
Why announcements can change execution conditions
Around a major release, a participant may reduce quoted size, widen prices or withdraw an order while reassessing fair value. Other participants may demand immediate execution. The combination can produce fewer available contracts near the old prices and faster transactions through the remaining levels.
This paragraph describes a mechanism, not a claim that every announcement produces the same pattern. The result depends on expectations, the surprise, positioning and how participants respond. High trading activity and difficult execution can occur together, as the liquidity discussion earlier showed.
For someone observing a release, useful questions include whether depth changed before the first large print, whether the spread widened, and how quickly quantity returned. “A big candle appeared” is the start of that investigation.
Use the book for the contract you execute
NQ and MNQ are different contracts, as are GC and MGC. Their related exposure does not make their displayed queues, prints or fills interchangeable. One MNQ contract has one tenth of NQ's point value; one MGC contract represents ten ounces compared with GC's 100. [6, 9, 24]
Ten micro contracts can match the price exposure of one larger contract. That does not guarantee matching transaction costs or fill behavior. A large buy seen in NQ is not an execution in your MNQ order book.
Expiry matters too. Liquidity is distributed across listed months and shifts during the roll. A continuous chart combines contracts according to a data provider's rules; it is not itself the contract sent to the exchange. For order-flow work, identify the actual symbol and expiry behind the display.
Comparisons between NQ and GC should also use compatible units. A 0.25-point NQ tick is $5 per contract; a $0.10-per-ounce GC tick is $10. A larger numerical price move or a larger count of contracts does not, by itself, tell you which trade carried more dollar exposure. [6, 23]
11 Reading a breakout with better questions
For a breakout trader, these mechanics can improve the quality of observation. They do not remove uncertainty about the next trade.
Imagine NQ approaches a clearly identified high. We can organize the observation into three stages.
Before the break, record the actual level and the context available at that time. Check the contract, nearby announcements, current spread and what your data can show. If you expect a reaction, write down what would count as one before seeing the outcome.
During the break, distinguish trades from displayed orders. Does buy-initiated activity reach progressively higher offers? Are offers replenishing at the same price? Does the best ask move because quantity trades or because it is removed? Do bids begin appearing at higher prices? These events describe different paths through the auction.
After the break, look at subsequent transactions and quotes. Does trading continue above the old high? Does price return into the prior range? How much time and executed quantity does your method require before calling the move sustained or failed?
There is no universal number of seconds or contracts that establishes “acceptance.” Define those terms if you intend to test them. Otherwise, it becomes easy to name a successful breakout after it has already succeeded.
For a breakdown, reverse the sides: follow aggressive selling into bids, any replenishment of those bids, and the quotes and trades that follow.
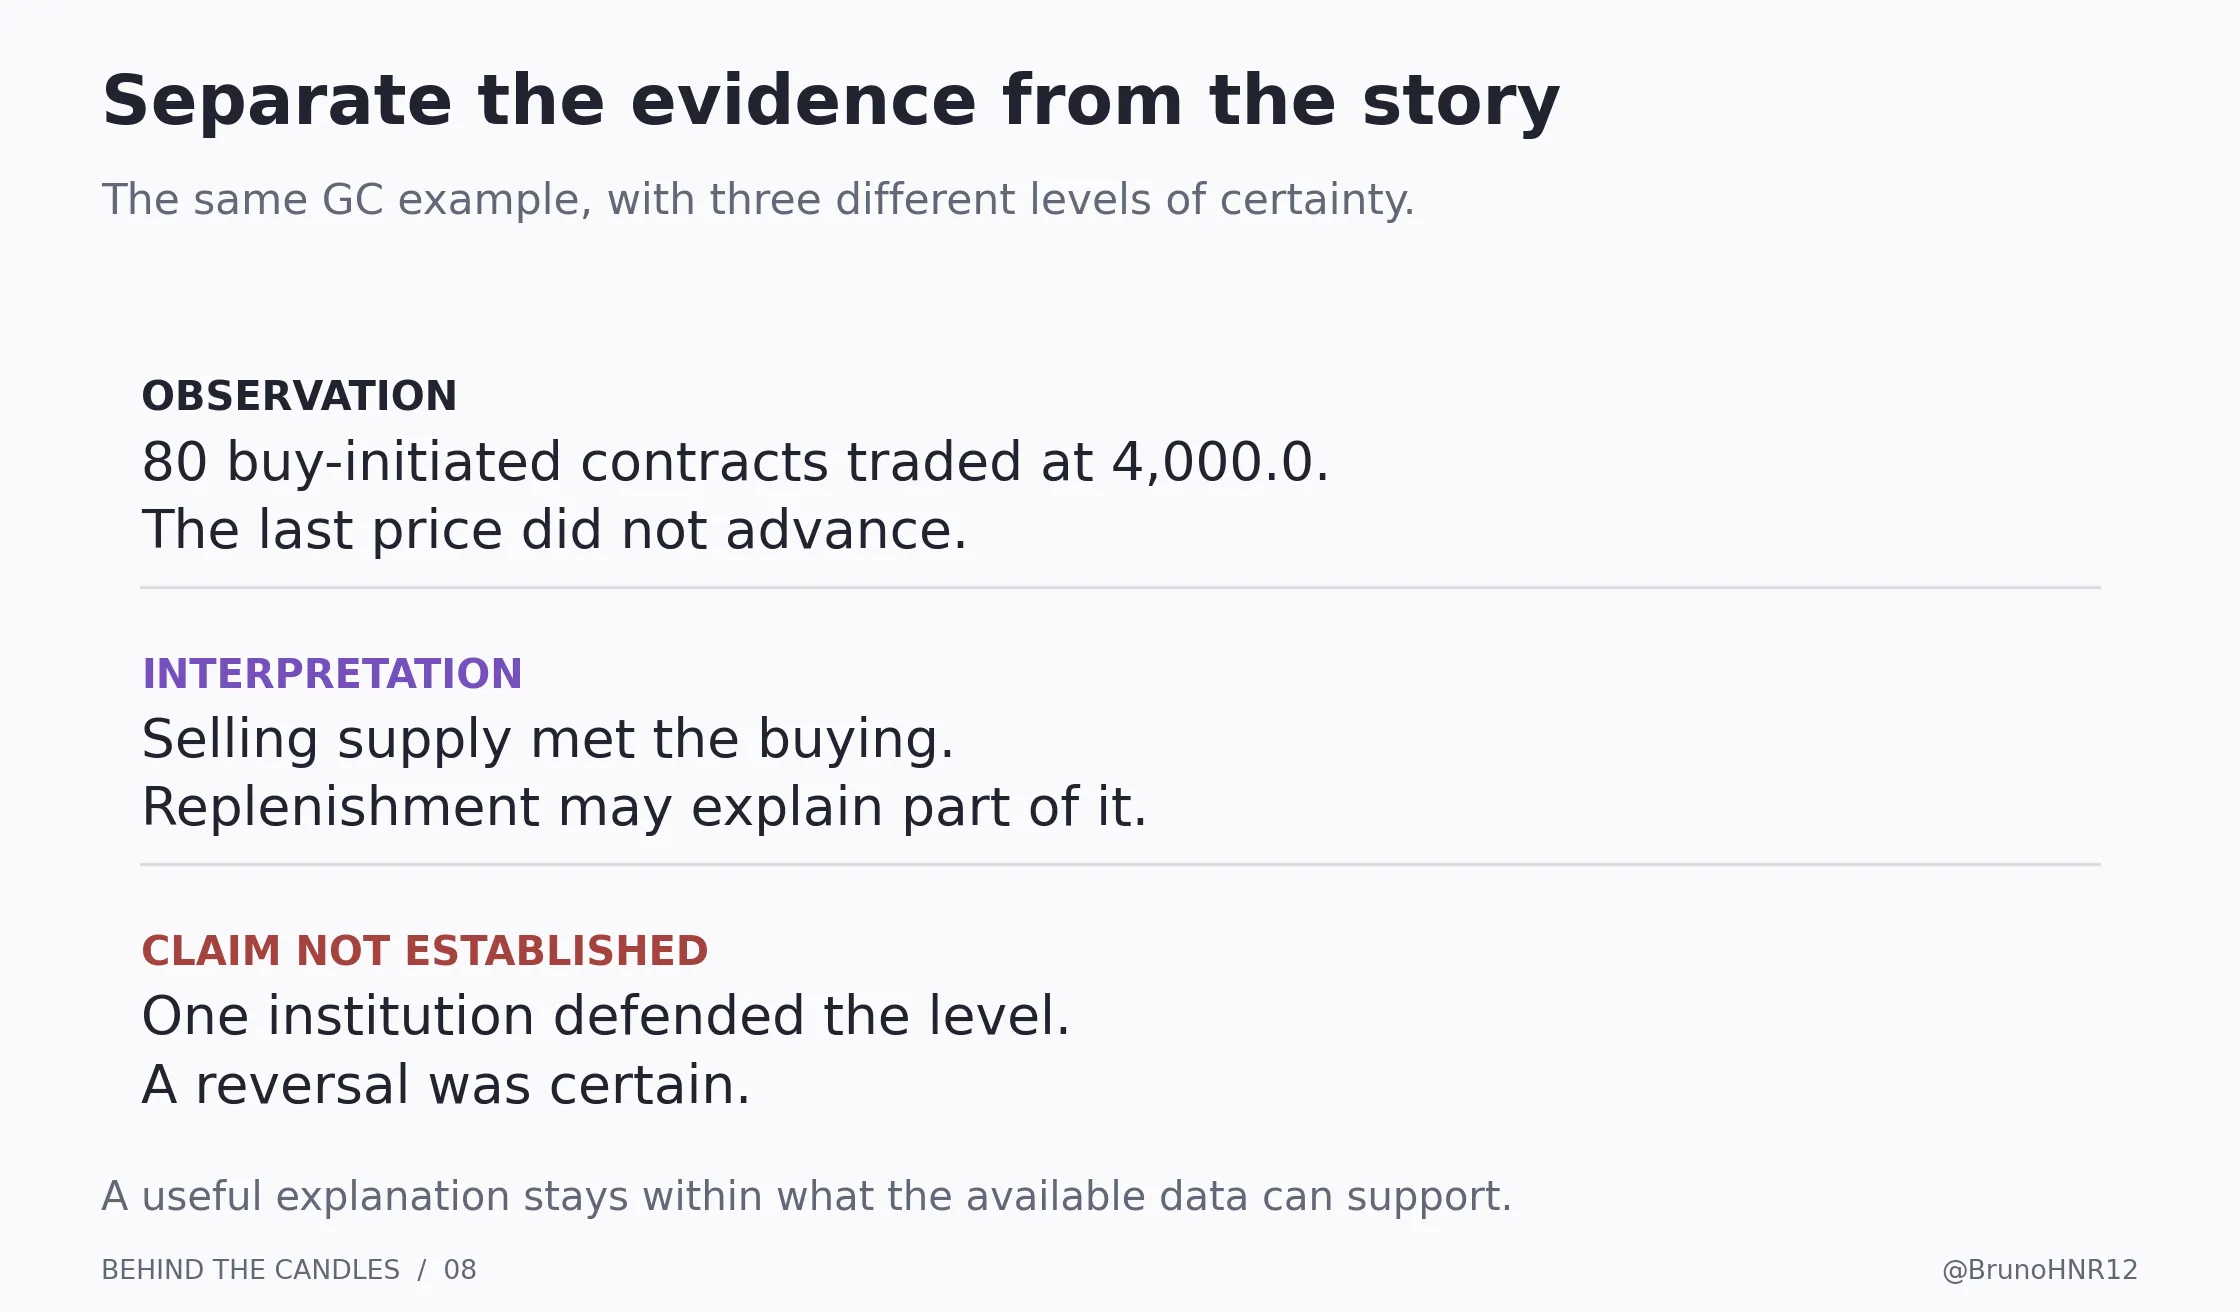
Here is a useful distinction in a journal:
- Observation: 80 buy-initiated GC contracts traded at 4,000.0, and the last trade did not advance during that sequence.
- Interpretation: selling supply met that buying at the level; replenishment may have contributed.
- Unproven claim: one institution was defending the level and a reversal was certain.
The first statement can be checked against adequate data. The second is an explanation whose detail depends on that data. The third goes beyond the evidence.
If you add to a winning position, the new contracts are another execution decision. Their fills, average entry and effect on the combined position must be included in the risk calculation. Unrealized profit on the first entry does not determine the liquidity available for the next one.
12 Turning an explanation into something testable
Understanding why a pattern can occur is different from establishing that trading it is profitable. A convincing replay is one example; a strategy needs repeated observations under rules that were specified before the outcome.
An approachable practice exercise is to replay ten minutes of one liquid contract around a level you marked beforehand. Pause before the outcome and write what the data shows. Resume, then compare the result with the possibilities you had recorded. Include failed and uneventful cases, not only dramatic moves.
For each case, record the contract and expiry, the timestamp and session, the initial spread, your relevant price level, what executed, and what remained unknown. If you simulate an order, record its type and execution assumptions as well.
When you later evaluate a rule, include fees, slippage and realistic limit-order fills. Test new data after developing the rule, and keep different sessions and news conditions identifiable. These are research choices, not claims that any particular order-flow pattern already has an edge.
You can begin this exercise with price and volume. Additional data is useful when it answers a defined question, such as whether a level traded heavily or simply lost its displayed orders. Buying another indicator without such a question leaves the interpretation problem unchanged.
13 Four checks for your understanding
One buyer trades ten contracts with ten different sellers. What is the volume? Ten contracts. The number of counterparties does not double the quantity exchanged.
The best ask rises after offers are cancelled, but no transaction occurs. Must the last traded price rise? No. The current offer and the last completed transaction are different values.
A bar has positive volume delta and closes lower. Is the data necessarily wrong? No. Our GC example shows how buying can be absorbed at one price before a smaller amount of selling reaches lower bids.
A stop has triggered. Does that establish that the position is flat? No. Confirm fills and remaining position. The order's rules and available liquidity determine execution.
14 What to take back to the chart
Keep these four questions beside your next replay:
- What traded? Identify execution prices and quantities.
- What was available? Examine bids, offers and changes in displayed depth where the data allows it.
- What did my order actually do? Check fills, average execution and any remaining quantity.
- What is still unknown? Leave participant identity, intent and future direction open when the evidence does not establish them.
A candle is a compressed record of transactions. Behind it are participants choosing prices, waiting in queues, taking available liquidity and changing their orders as conditions evolve.
The NQ sweep and the GC absorption example showed why the same idea of “buying pressure” can produce very different outcomes. Quantity matters in relation to available liquidity and to the sequence in which events occur.
On your next replay, choose one move and describe it using only what your data establishes. Note what traded, what was quoted, what changed, and what you still cannot know. That is a practical way to replace a vague market story with an explanation you can check.
Which is harder for you to read in real time: a breakout that keeps going, or heavy volume that barely moves price?
Educational material. Hypothetical examples explain execution mechanics and do not establish a profitable trading strategy.
Short glossary
- Aggressor: the side initiating an execution against available resting liquidity.
- Ask or offer: a price at which a sell order is available.
- Bid: a price at which a buy order is available.
- CVD: cumulative volume delta from a chosen starting point.
- Depth: resting quantity at one or more price levels.
- DOM: a display of market depth, often arranged as a price ladder.
- FIFO: first in, first out; time priority among ordinary orders at the same price under this matching method.
- Footprint: executed volume displayed at individual price levels within a bar.
- Iceberg: an order that displays only part of its total quantity.
- Marketable limit: a limit order priced to execute against available opposing orders.
- Midpoint: the average of the best bid and ask.
- Replenishment: new displayed quantity replacing quantity that has traded or disappeared.
- Slippage: the difference between an execution price and a specified benchmark.
- Spread: best ask minus best bid.
- Volume delta: buy-initiated minus sell-initiated traded quantity under a specified classification method.
Sources and further reading
Exchange mechanics and specifications were checked on October 2, 2026. Historical research retains its original date and market scope. Illustrations are original simplified examples. Sources explain market mechanics; they do not validate the practical trading observations as profitable strategies.
[1] CME Group, A Trader's Guide to Futures. Volume counts one side of the quantity exchanged; glossary and liquidity discussion, printed pages 25 and 26.
[2] Bookmap, Market Mechanics. Order-book terminology and the interaction between resting and arriving orders.
[3] CME Group, Globex electronic trading. Electronic order entry and market access.
[4] CME Group, Product Anniversaries. Globex launch on June 25, 1992.
[5] CME Group, Understanding the CME Liquidity Tool Methodology. Book updates, bid-ask spread and cost to trade across levels.
[6] CME Group, E-mini Nasdaq-100 futures specifications. NQ point value and outright tick.
[7] CME Group, Futures Order Types. Limit prices, marketable limits and stop-order introduction.
[8] CME Group Client Systems Wiki, Order Types for Futures and Options. Market-with-protection, stop-limit and stop-with-protection behavior, including unfilled remainders.
[9] CME Group, Micro E-mini equity index futures FAQ. Contract sizes and FIFO matching, including the relationship to E-mini counterparts.
[10] CME Group, Matching Algorithm Overview. Matching methods vary across products.
[11] Rama Cont, Arseniy Kukanov and Sasha Stoikov, The Price Impact of Order Book Events, first posted 2010. Empirical research on 50 US stocks, not a futures strategy test.
[12] CME Group, How Traders Measure Liquidity. Spread and displayed quantity as complementary liquidity measures.
[13] Hai-Chuan Xu and coauthors, Limit-order book resiliency after effective market orders, 2016. Research on liquidity recovery using Chinese stock data; cited for the concept of resilience, not transferable numerical trading rules.
[14] CFTC and SEC staff, Findings Regarding the Market Events of May 6, 2010, September 30, 2010. E-mini volume and liquidity discussion, printed pages 15 and 16.
[15] Bookmap, Iceberg Orders Tracker, updated April 28, 2026. Iceberg mechanics, absorption and detection limitations.
[16] CME Group, Display Quantity Order Overview. Displayed quantities and replenishment.
[17] CME Group, Market by Order FAQ. MBP and MBO, anonymous identifiers and native versus externally managed icebergs.
[18] CME Group, Rule 575 Disruptive Practices advisory RA2608-5, dated July 30, 2026; effective August 13, 2026. In particular, Rule 575.A and FAQ 4 on legitimate subsequent modification or cancellation.
[19] Sierra Chart, Numbers Bars. Bid/ask volume, footprint calculations and delta conventions.
[20] CME Group Client Systems Wiki, MDP 3.0 Trade Summary. AggressorSide, trade reporting and spread-leg reporting conditions.
[21] Sierra Chart, Cumulative Delta Bars Volume. Cumulative calculations, reset settings and historical-data requirements.
[22] CME Group, Price Discovery. How bids and offers transmit changing supply and demand.
[23] CME Group, Gold futures specifications and COMEX Chapter 113. GC contract size and outright tick. Broader instrument context is developed in the earlier GC guide.
[24] CME Group, Micro Gold futures specifications. MGC size and tick value.
Understand the market. Execute your plan.
Market knowledge and discipline are different challenges. Individual coaching focuses on your performance, decisions and the obstacles you face during a session.