
RISK MANAGEMENT · NQ / GC · FUTURES
Behind the RiskPosition Sizing, Drawdowns and Survival in Futures Trading
What one contract, one stop and one losing streak can do to your account.

Six educational diagrams. All numerical examples are hypothetical and expressed in US dollars.
Sources checked on 4 October 2026. All trade prices, account paths and cost assumptions below are educational examples, not live quotes or a strategy backtest. Dollar amounts are USD.
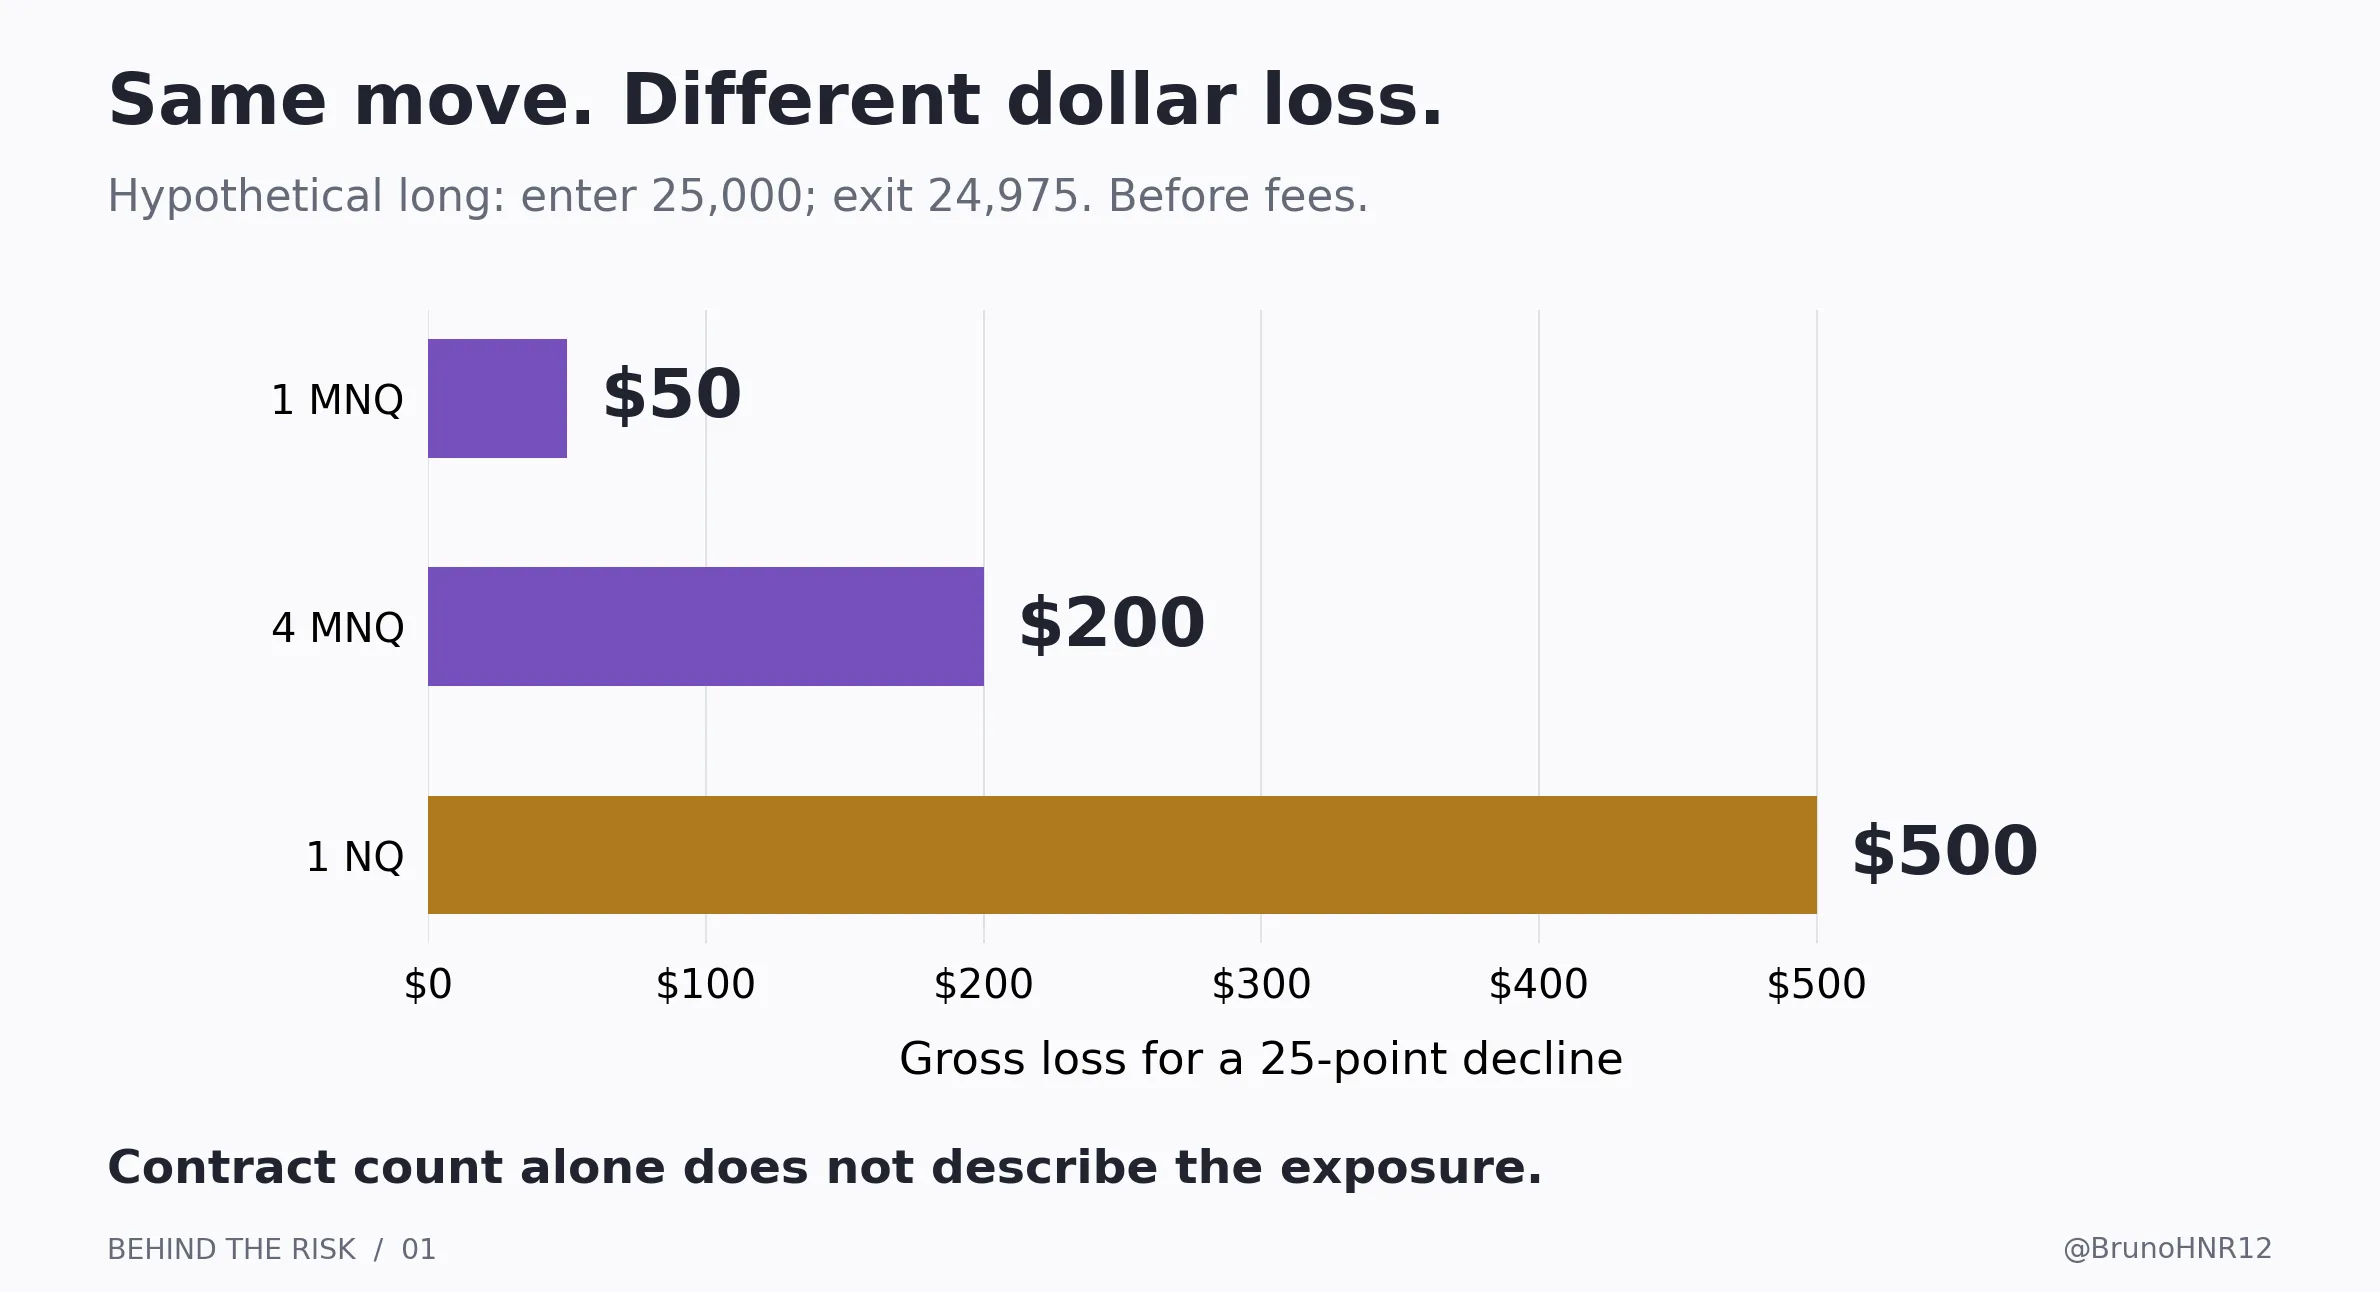
Two traders buy the same Nasdaq move. Both enter at 25,000 and exit at 24,975.
One trades a single MNQ contract and loses $50. The other trades a single NQ contract and loses $500. Those figures are before fees. The chart is almost identical. The impact on their accounts is not.
Your position size turns a movement on a chart into a financial consequence. Understanding the entry is only part of understanding the trade.
The NQ and GC guides explain the instruments. Behind the Candles explains how orders become transactions and prices. This article takes the next step: calculating exposure, preparing for losses and understanding what changes when you increase a position.
You should leave able to check a risk calculation yourself, explain why a stop is not a guaranteed loss ceiling, and see why several individually reasonable trades can become an oversized combined bet.
The article in two minutes
- Calculate dollars, not just contracts. Stop distance, contract value and quantity determine the planned price loss.
- Margin and risk answer different questions. Being allowed to open a position does not tell you what it can cost.
- Allow for execution and fees. Your stop is an instruction; the final fills determine your result.
- Plan for a sequence of trades. A losing streak can occur even when a method has positive expected returns.
- Recalculate after every addition. A profitable first entry does not make new contracts free of risk.
- Use the right account reference. A funded account label and its remaining loss allowance can be very different numbers.
- Judge the method after costs and across many trades. Risk management controls exposure. It cannot manufacture a trading edge.
1 How price movement becomes profit or loss
Key takeaway
The same price movement produces different dollar results at different position sizes. Contract quantity has meaning only when you also know the contract's value per unit of price movement.
Buying a futures contract creates a long position. A higher exit price produces a gross profit; a lower exit price produces a gross loss. A short position reverses that relationship: you sell first and benefit from buying back lower.
For a long position, gross profit or loss is the exit price minus the entry price, multiplied by the dollar value of one price unit and the number of contracts. For a short, subtract the exit from the entry instead. Gross means before commissions and other charges.
Here are the four contracts used in this article. These are outright futures increments, not options or spread increments. [1, 2, 3]
- NQ: One price unit means: 1 index point. Dollar value per unit: $20. Smallest price step: 0.25 points. Value of one tick: $5.
- MNQ: One price unit means: 1 index point. Dollar value per unit: $2. Smallest price step: 0.25 points. Value of one tick: $0.50.
- GC: One price unit means: $1 per troy ounce. Dollar value per unit: $100. Smallest price step: $0.10 per ounce. Value of one tick: $10.
- MGC: One price unit means: $1 per troy ounce. Dollar value per unit: $10. Smallest price step: $0.10 per ounce. Value of one tick: $1.
A tick is one permitted price step. One NQ point contains four ticks. One dollar per ounce in gold contains ten ticks. Mixing points and ticks creates a risk calculation error before the trade even starts.
Consider a 25-point adverse Nasdaq move. One MNQ loses $50, four MNQ lose $200, and one NQ loses $500 before fees. Ten MNQ have the same dollar sensitivity as one NQ, although their fees and executions need not match.
Gold requires equal care with units. A move from 4,000 to 3,994 is a $6-per-ounce move. For one GC, the gross loss on a long is $600. For one MGC, it is $60. A six-unit move on a gold chart is not a six-dollar account loss.
Your result is unrealized while the position remains open and realized when you close it. An open loss still reduces account equity. For this article, equity means the account's marked value including open profit or loss and applicable charges. A closed-trade balance alone does not describe the current exposure.
2 Separate exposure margin equity and planned risk
Key takeaway
Margin is a requirement for holding a position, not a maximum loss. The position's market exposure, the account's equity and your planned loss are separate quantities.
At an illustrative NQ price of 25,000, one NQ has a notional value of $500,000: 25,000 multiplied by $20. One MNQ has $50,000 of notional exposure at that price. Notional is a way to express the scale of the exposure; it is not the cash purchase price of the contract.
Futures margin is collateral required to support the position. Initial and maintenance requirements help determine whether you can open and maintain it. Requirements can change, and an account that falls short can face a demand for funds or liquidation. [4]
Imagine a personal account with $10,000 of equity, holding one MNQ at 25,000 with a planned exit 25 points lower. Its notional exposure is $50,000, and its planned price loss is $50. The applicable margin is another number, supplied by the broker's current requirements. There is no reason for those three amounts to be equal.
The notional exposure in that example is five times account equity. If the underlying futures price falls 1%, that one MNQ loses $500 before fees: 5% of the initial $10,000 equity. This is one way to see leverage numerically. It assumes the position stays open throughout the move.
A small margin requirement does not shrink the contract's dollar sensitivity. NFA also cautions that futures leverage can produce obligations beyond the amount a trader expected to commit. [5]
A planned stop can reduce exposure when it executes, but its intended result should never be confused with a contractual cap on losses. We will separate those two ideas shortly.
3 Choose quantity from the trade and the risk budget
Key takeaway
Choose a meaningful invalidation level, calculate the loss per contract, then work out the quantity. If the resulting quantity is zero, that proposed trade does not fit the budget in that contract.
An invalidation level is the price at which your trade idea no longer meets its own rules. For a breakout strategy, that might be a return through a level defined before entry. The precise rule belongs to the strategy and needs testing. A random stop chosen to make a preferred contract count affordable changes the trade itself.
CME's position-sizing lesson starts with the stop location and the amount the trader is prepared to risk. We can apply that principle while also allowing for trading costs. [6]
The basic calculation is straightforward:
Planned price loss per contract = entry-to-stop distance × dollar value per price unit.
Add estimated round-trip fees and an execution allowance per contract. Divide the trade's dollar budget by that combined amount, then round down to a whole number of contracts. This is a planning estimate, not a guarantee about the final loss. Applicable margin requirements and account position limits can reduce the permitted quantity further.
A complete MNQ example
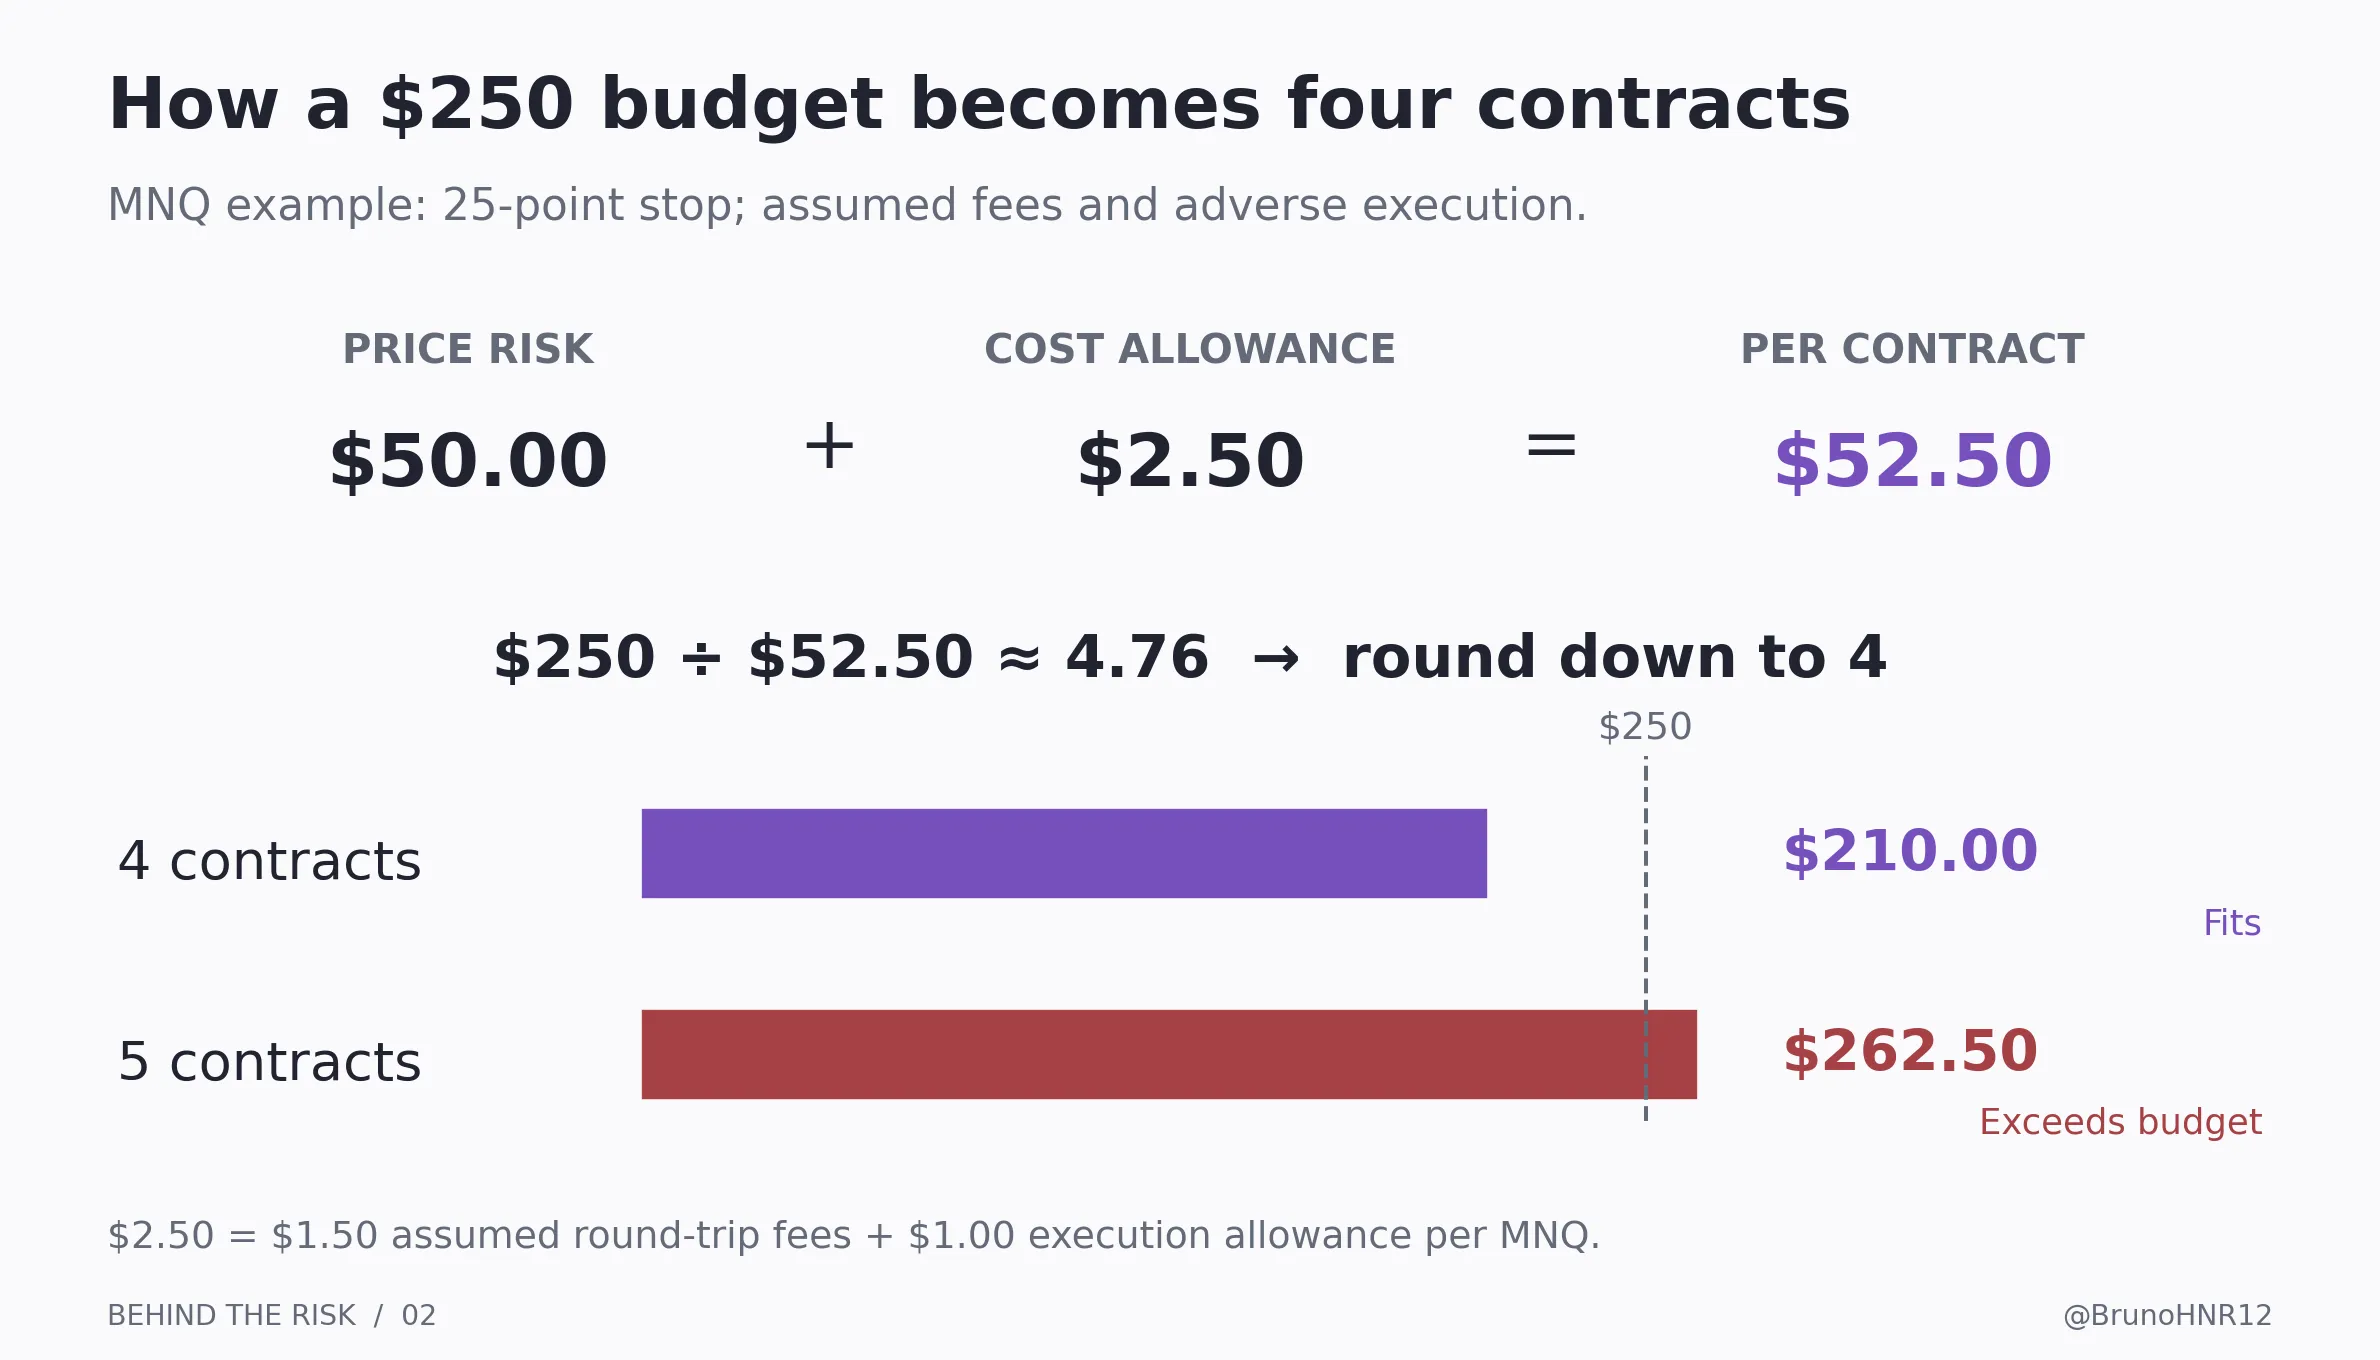
Suppose the proposed long entry is 25,000 and the stop trigger is 24,975. The distance is 25 points, or 100 ticks. Set an illustrative total trade budget of $250.
- Price loss per MNQ at the stop: 25 × $2 = $50.
- Assumed round-trip commissions and fees: $1.50 per contract.
- Assumed adverse execution allowance: two ticks per contract across entry and exit, worth $1.
- Planned amount per contract: $50 + $1.50 + $1 = $52.50.
- $250 divided by $52.50 is about 4.76, so the quantity is four MNQ.
Four contracts produce $200 of price risk, $6 of assumed fees and $4 of execution allowance: $210 in total. Five produce $262.50, exceeding the $250 budget. The remaining $40 is unused capacity, not a requirement to find another trade.
These fees and execution assumptions are invented for the calculation. Replace them with your actual all-in charges and evidence from comparable fills. A quiet-session assumption may be unsuitable for a fast market.
One NQ with that same stop has $500 of price risk before any fees. It does not fit this budget. Choosing NQ because the broker permits it would answer the margin question while ignoring the trade's risk question.
The equivalent calculation for gold
Consider a short gold trade at 4,000 with a stop trigger at 4,006. The distance is $6 per ounce. One MGC has $60 of price risk; one GC has $600.
For a separate illustrative $200 budget, suppose one MGC also requires $2 of round-trip fees and $2 of adverse execution allowance. The planning amount is $64 per contract, allowing three MGC at $192. Four would require $256. This is the same calculation with different units.
A wider stop changes the permitted size
Return to the MNQ example. If the strategy calls for a 50-point stop instead of 25, the price risk becomes $100 per MNQ. Keeping the same $2.50 cost allowance gives $102.50 per contract. The $250 budget then allows two, not four.
This is how quantity can adapt to a wider price range. It does not mean that every volatile session should be traded with a wider stop. You still need a valid setup and a reason to expect the strategy to work in those conditions.
There is also no universal safe percentage. A fraction of personal account equity, a fraction of a prop account's remaining loss allowance and a fixed dollar budget describe different constraints. The percentages in later examples illustrate consequences; they are not recommendations.
4 Your stop is an instruction and your fill is the result
Key takeaway
Planned loss and realized loss can differ. Execution quality, incomplete fills and charges determine what the trade actually costs.
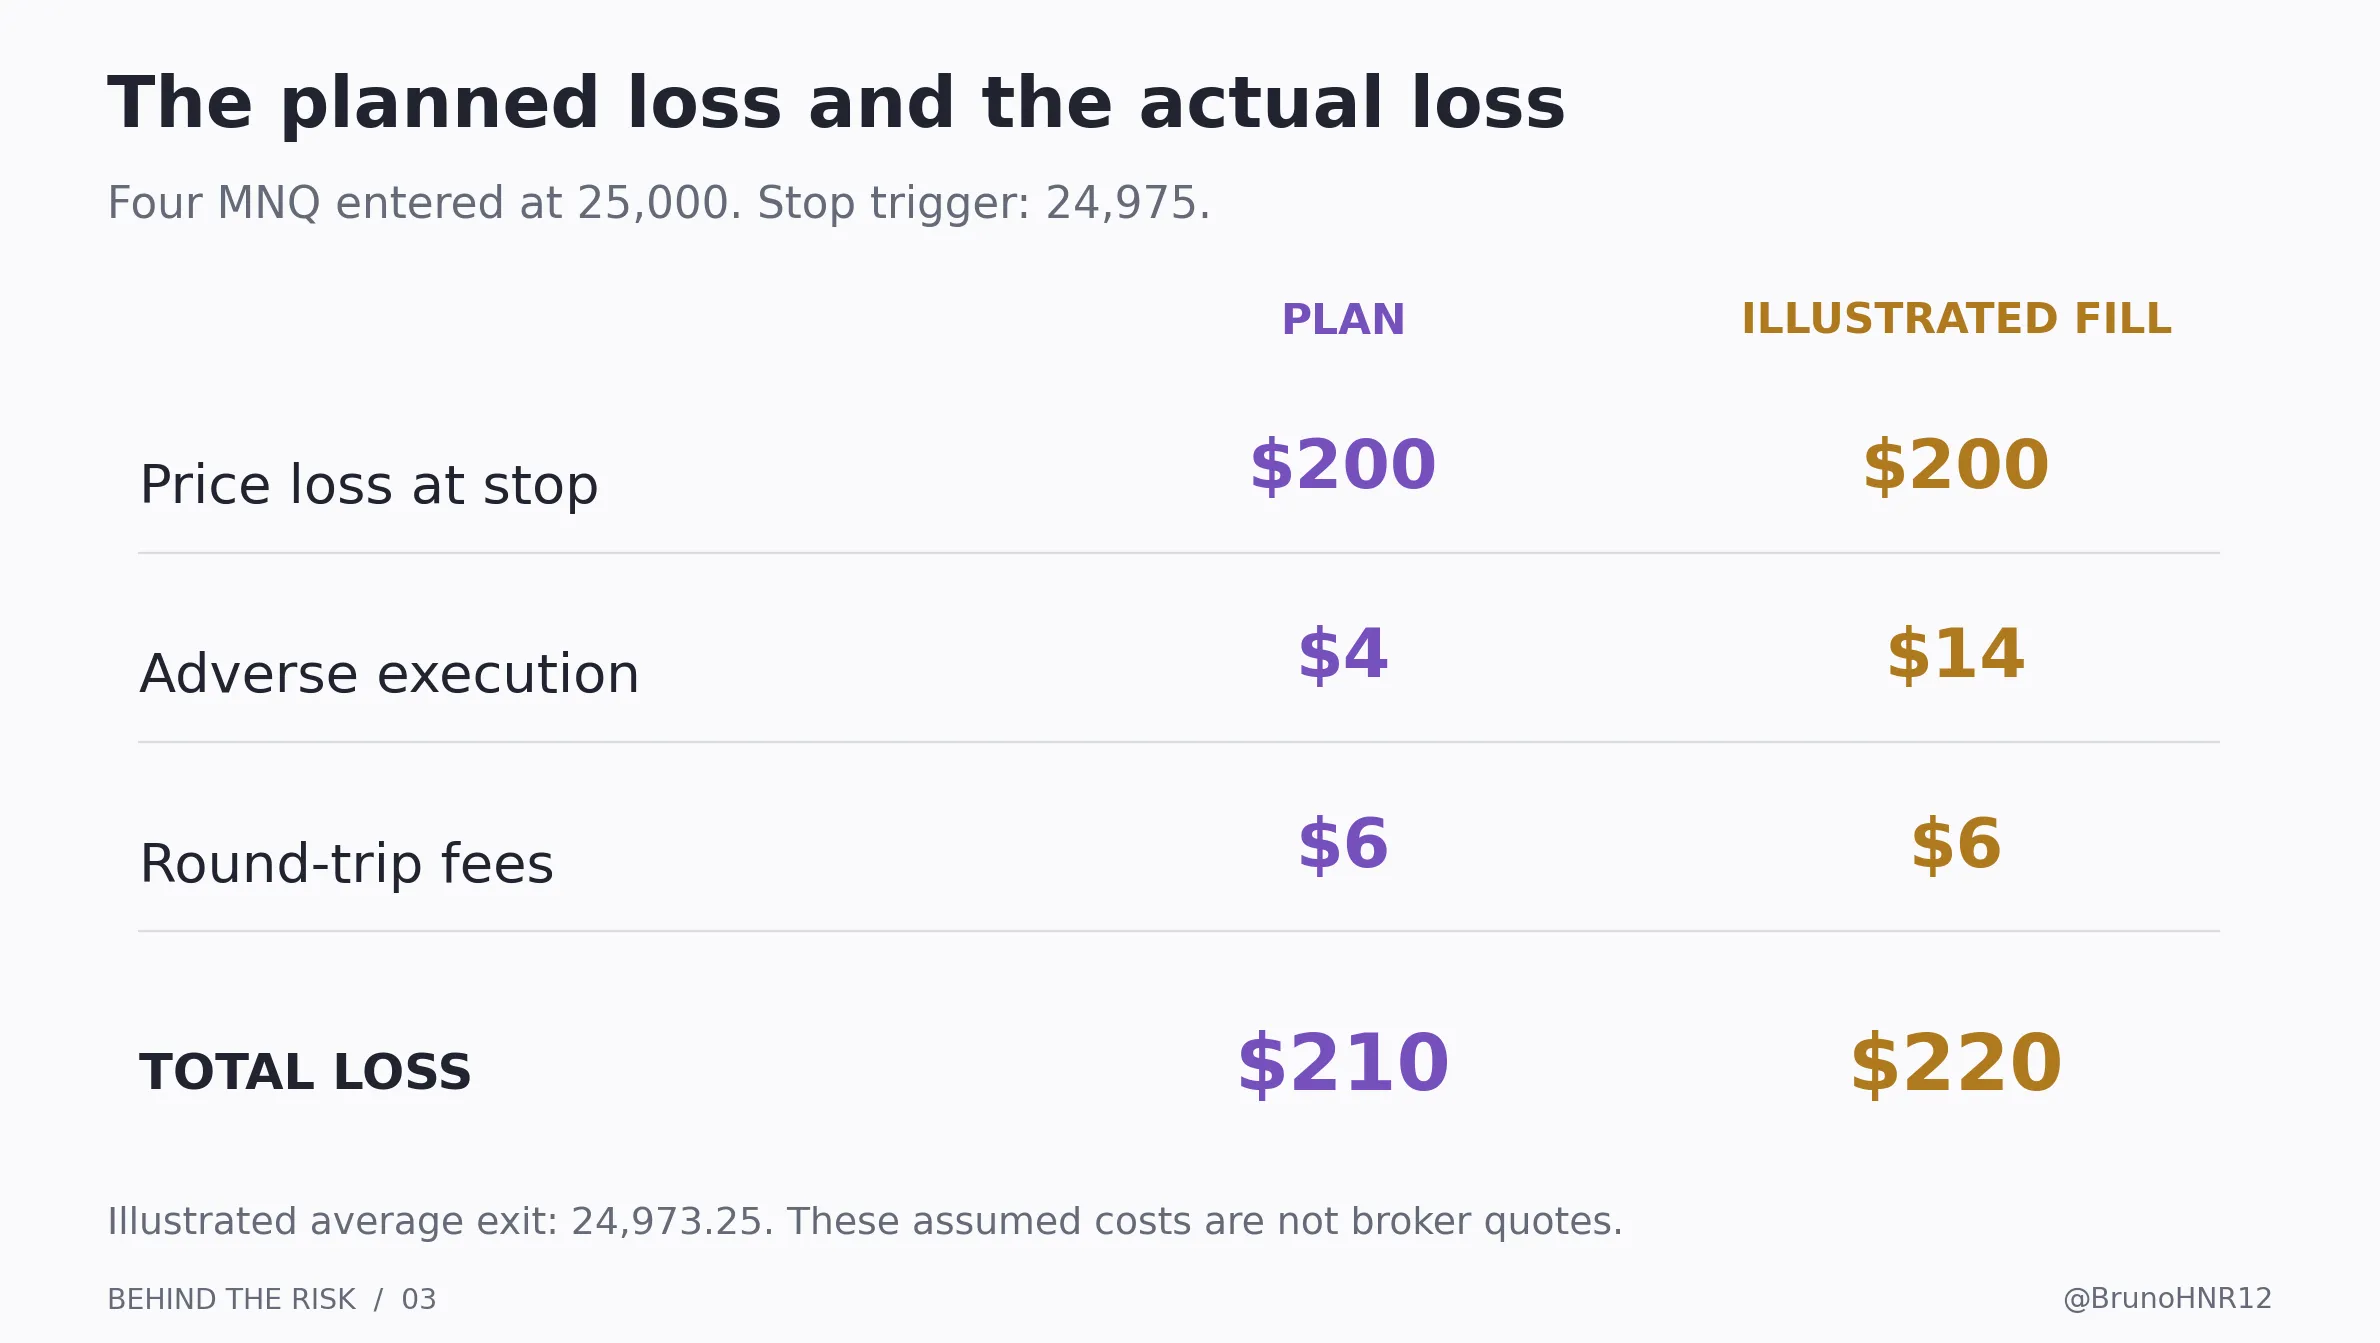
Take the four-MNQ long from the sizing example. Assume all four fill at 25,000. The stop trigger is 24,975, giving $200 of planned price risk.
Now suppose all four finally sell at an average of 24,973.25. The adverse move is 26.75 points. The price loss is 26.75 × $2 × 4 = $214. Add the assumed $6 round-trip fees, and the realized loss is $220.
The plan allowed $210. The result cost $10 more because the actual adverse execution was $14 rather than the $4 allowance. This example still fits the original $250 budget, but a larger deviation could exceed it.
Behind the Candles covers order mechanics in detail. The risk consequence is worth retaining: a stop-limit can remain unfilled, and a native CME stop with protection only executes within its permitted range. Unfilled quantity can remain as a limit order. A triggered stop therefore does not establish that the whole position is closed. [7]
Check the exact order type your platform sends, whether the exchange, broker or local platform manages it, and what happens during a disconnection. A button labelled Stop Loss is not enough information to answer those questions.
When sizing before entry, an allowance for spread and slippage helps account for the gap between reference prices and attainable fills. When reviewing a completed trade, use its actual fills. Do not subtract the same spread or slippage again if it is already included in the entry and exit prices. Deduct commissions and other charges that remain outside those prices.
Use a second, adverse execution scenario alongside the usual estimate. For example, calculate the loss at an exit several ticks beyond the intended level, using conditions relevant to your market and session. That is a stress scenario, not a claim to have discovered the worst possible loss.
This matters even for day traders who avoid scheduled announcements. Avoiding a known release removes one chosen exposure; it does not prevent an unexpected headline, a gap or an order-handling problem.
5 Decide what one R means before measuring results
Key takeaway
R is a unit for comparing trades, and its definition must stay consistent. Here, one R is the initial planned price risk, before execution differences and fees.
In our four-MNQ example, one R is $200. The $250 budget is the maximum planning allocation; it is not automatically the R denominator. The $210 estimate includes costs and an execution allowance. Those numbers have different jobs.
If the completed trade earns $400 gross, it earns +2R before fees. If it loses the illustrated $220 after fees, it loses -1.10R net. Exceeding -1R is possible because R is a reference amount, not a guaranteed limit.
Some traders define R using an all-in initial risk estimate instead. That convention can also work if it is stated and applied consistently. Mixing conventions between trades makes the statistics harder to interpret.
Freeze the initial R for performance reporting. Moving the stop or adding contracts should not rewrite the historical denominator to make the result look better. Separately track the position's updated risk as it changes.
For example, a $100 net gain is +1R when the initial R was $100, but only +0.25R when the initial R was $400. A dollar result alone does not reveal how much initial risk produced it.
6 A high win rate can still lose money
Key takeaway
Win frequency and win size must be considered together. The relevant question is the average result after all costs, under realistic execution.
Expected value, often called expectancy in trading, is the probability-weighted average outcome. A simple two-outcome model combines the chance of a win with the average winner, and the chance of a loss with the average loser. CME uses this framework to explain why accuracy alone does not establish profitability. [8]
Consider two hypothetical methods. Assume every trade uses the same dollar R, there are no breakeven trades, and average wins and losses are stated before costs.
- A: Win rate: 70%. Average winner: +0.30R. Average loser: -1R. Gross expectancy per trade: -0.09R. After assumed 0.10R cost: -0.19R.
- B: Win rate: 40%. Average winner: +2R. Average loser: -1R. Gross expectancy per trade: +0.20R. After assumed 0.10R cost: +0.10R.
For A, 0.70 × 0.30R minus 0.30 × 1R equals -0.09R. Frequent small wins do not cover the less frequent larger losses. For B, 0.40 × 2R minus 0.60 × 1R equals +0.20R before the assumed cost.
These are constructed numbers, not evidence that either method exists. If actual fills already determine the measured win and loss sizes, subtract only charges not already included. If you use net results throughout, do not subtract costs again.
A two-R target on a chart is also not proof that your average winner is two R. Partial exits, early exits, missed fills and different loss sizes can change the distribution. Moving a target farther away may reduce how often it is reached.
In the simplified +2R/-1R model, the gross break-even win rate is one third. A uniform additional cost of 0.10R raises it to about 36.7%. The calculation is 1.10 divided by 3: each winner nets 1.90R, and each loser costs 1.10R.
Use actual trade records, including failures and charges, to estimate your own distribution. A positive historical average can be noise, can be dominated by a few trades, and can disappear in new conditions. It is not a promise about the next trade or the next month.
Risk management influences how large the consequences become. By itself, reducing the size of a negative-expectancy method does not turn its expected return positive.
7 Prepare for losing streaks before they arrive
Key takeaway
A sequence of losses can occur without proving the method has stopped working. Its effect on the account depends heavily on the risk taken on each trade.
Imagine a deliberately simplified model with an independent 50% chance of losing each trade. The probability that the next five trades all lose is 0.5 multiplied by itself five times: 3.125%.
That is the probability of one specific five-trade block. It is not the probability of encountering five consecutive losses somewhere in a longer history. Across 100 trades, the exact probability of at least one run of five losses is about 81.0% in this model. There are many possible starting points for the run, and overlapping runs must be counted correctly.
Real trades need not be independent, and the win probability need not stay fixed. A strategy can encounter several related losses during the same unsuitable market condition. The coin-flip calculation teaches the distinction between a selected block and a long sequence; it does not forecast your personal losing streak.
What ten losses do to different risk fractions
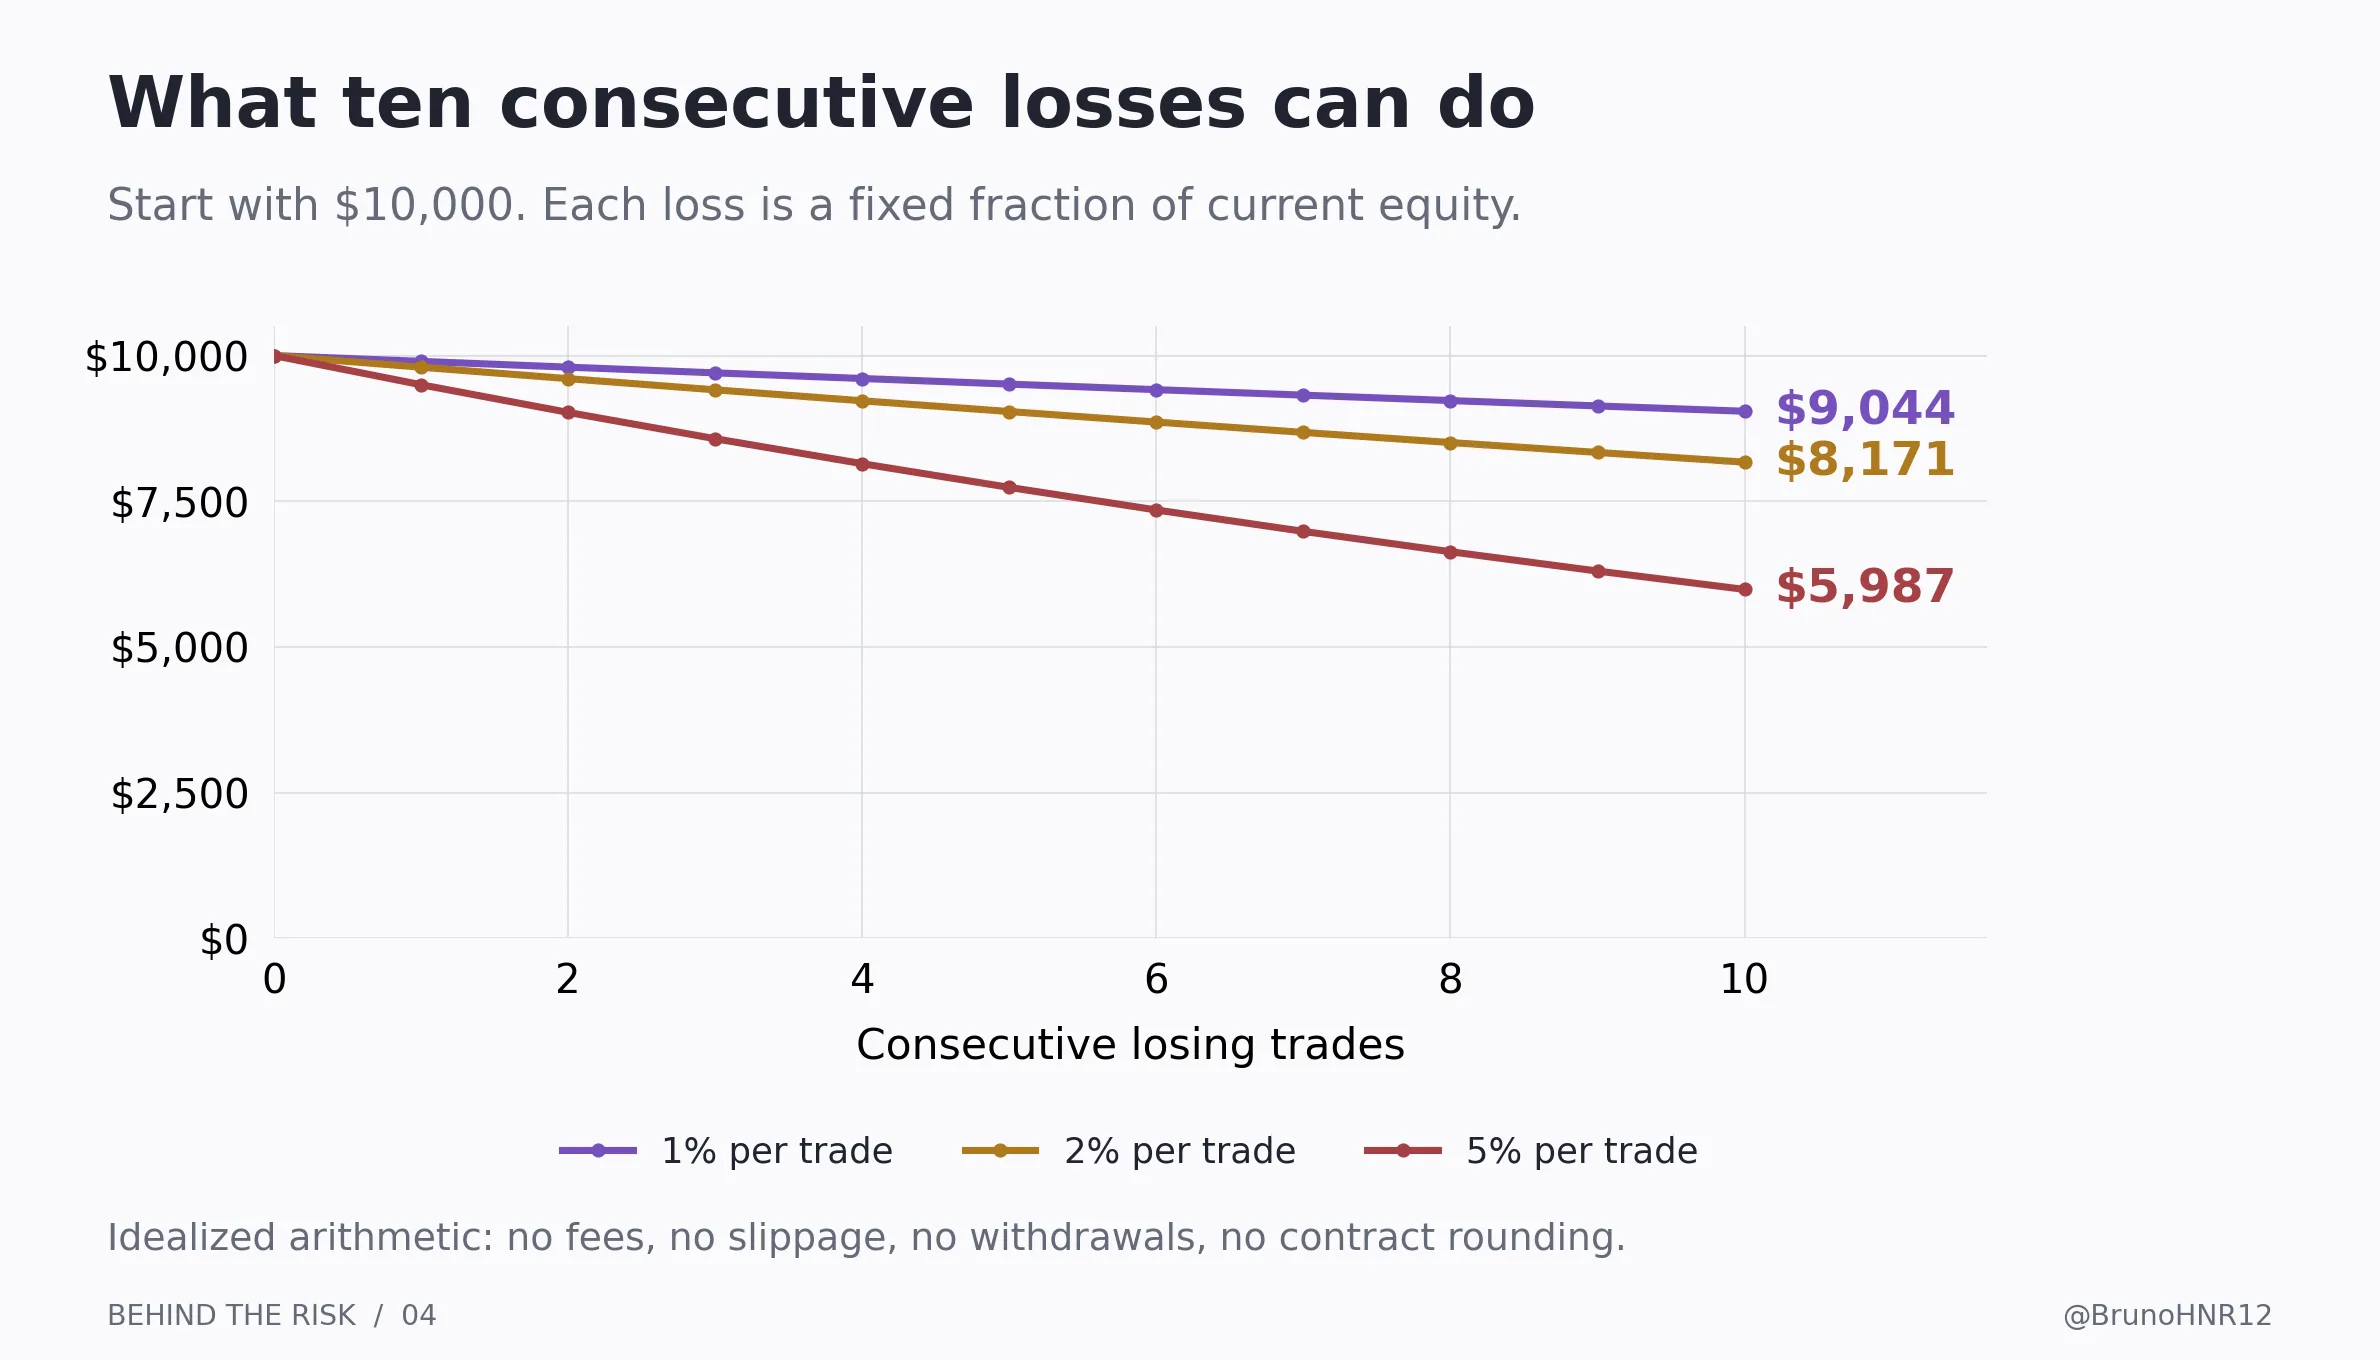
Start with an illustrative $10,000 account. Suppose each loss removes exactly the chosen fraction of the equity immediately before that trade. Assume fractional sizing is possible, no costs, no withdrawals and no gains during the sequence.
- 1% of current equity: Equity after ten losses: $9,043.82. Drawdown from $10,000: 9.56%.
- 2% of current equity: Equity after ten losses: $8,170.73. Drawdown from $10,000: 18.29%.
- 5% of current equity: Equity after ten losses: $5,987.37. Drawdown from $10,000: 40.13%.
The calculation is starting equity multiplied by the remaining fraction ten times. At 2% risk, that is $10,000 × 0.98 raised to the tenth power. This is arithmetic under fixed assumptions, not a simulated trading strategy.
Fixed-dollar risk behaves differently. Losing $500 on each of those ten trades would leave $5,000. The dollar amount stays constant while its percentage of the shrinking account grows.
Actual futures sizing uses whole contracts, so you cannot always apply an exact percentage. If even one chosen contract exceeds the allowed amount, the mathematical answer remains zero contracts for that proposal. Lowering the stop distance solely to override that answer changes the strategy you are evaluating.
One further trap is increasing size after losses to recover faster. Starting at $100 and doubling the amount after every loss produces a planned sixth loss of $3,200. Six losses total $6,300. The account can reach its limits well before the hoped-for recovery trade appears.
8 Recovery becomes harder as the account shrinks
Key takeaway
The percentage needed to recover is larger than the percentage lost. The recovery starts from a smaller base.
If $10,000 falls to $8,000, the loss is 20%. Recovering the missing $2,000 now requires a 25% gain on $8,000. A 50% decline leaves $5,000 and requires a 100% gain to return to $10,000.
- 10%: Gain needed to recover: 11.1%.
- 20%: Gain needed to recover: 25.0%.
- 30%: Gain needed to recover: 42.9%.
- 40%: Gain needed to recover: 66.7%.
- 50%: Gain needed to recover: 100.0%.
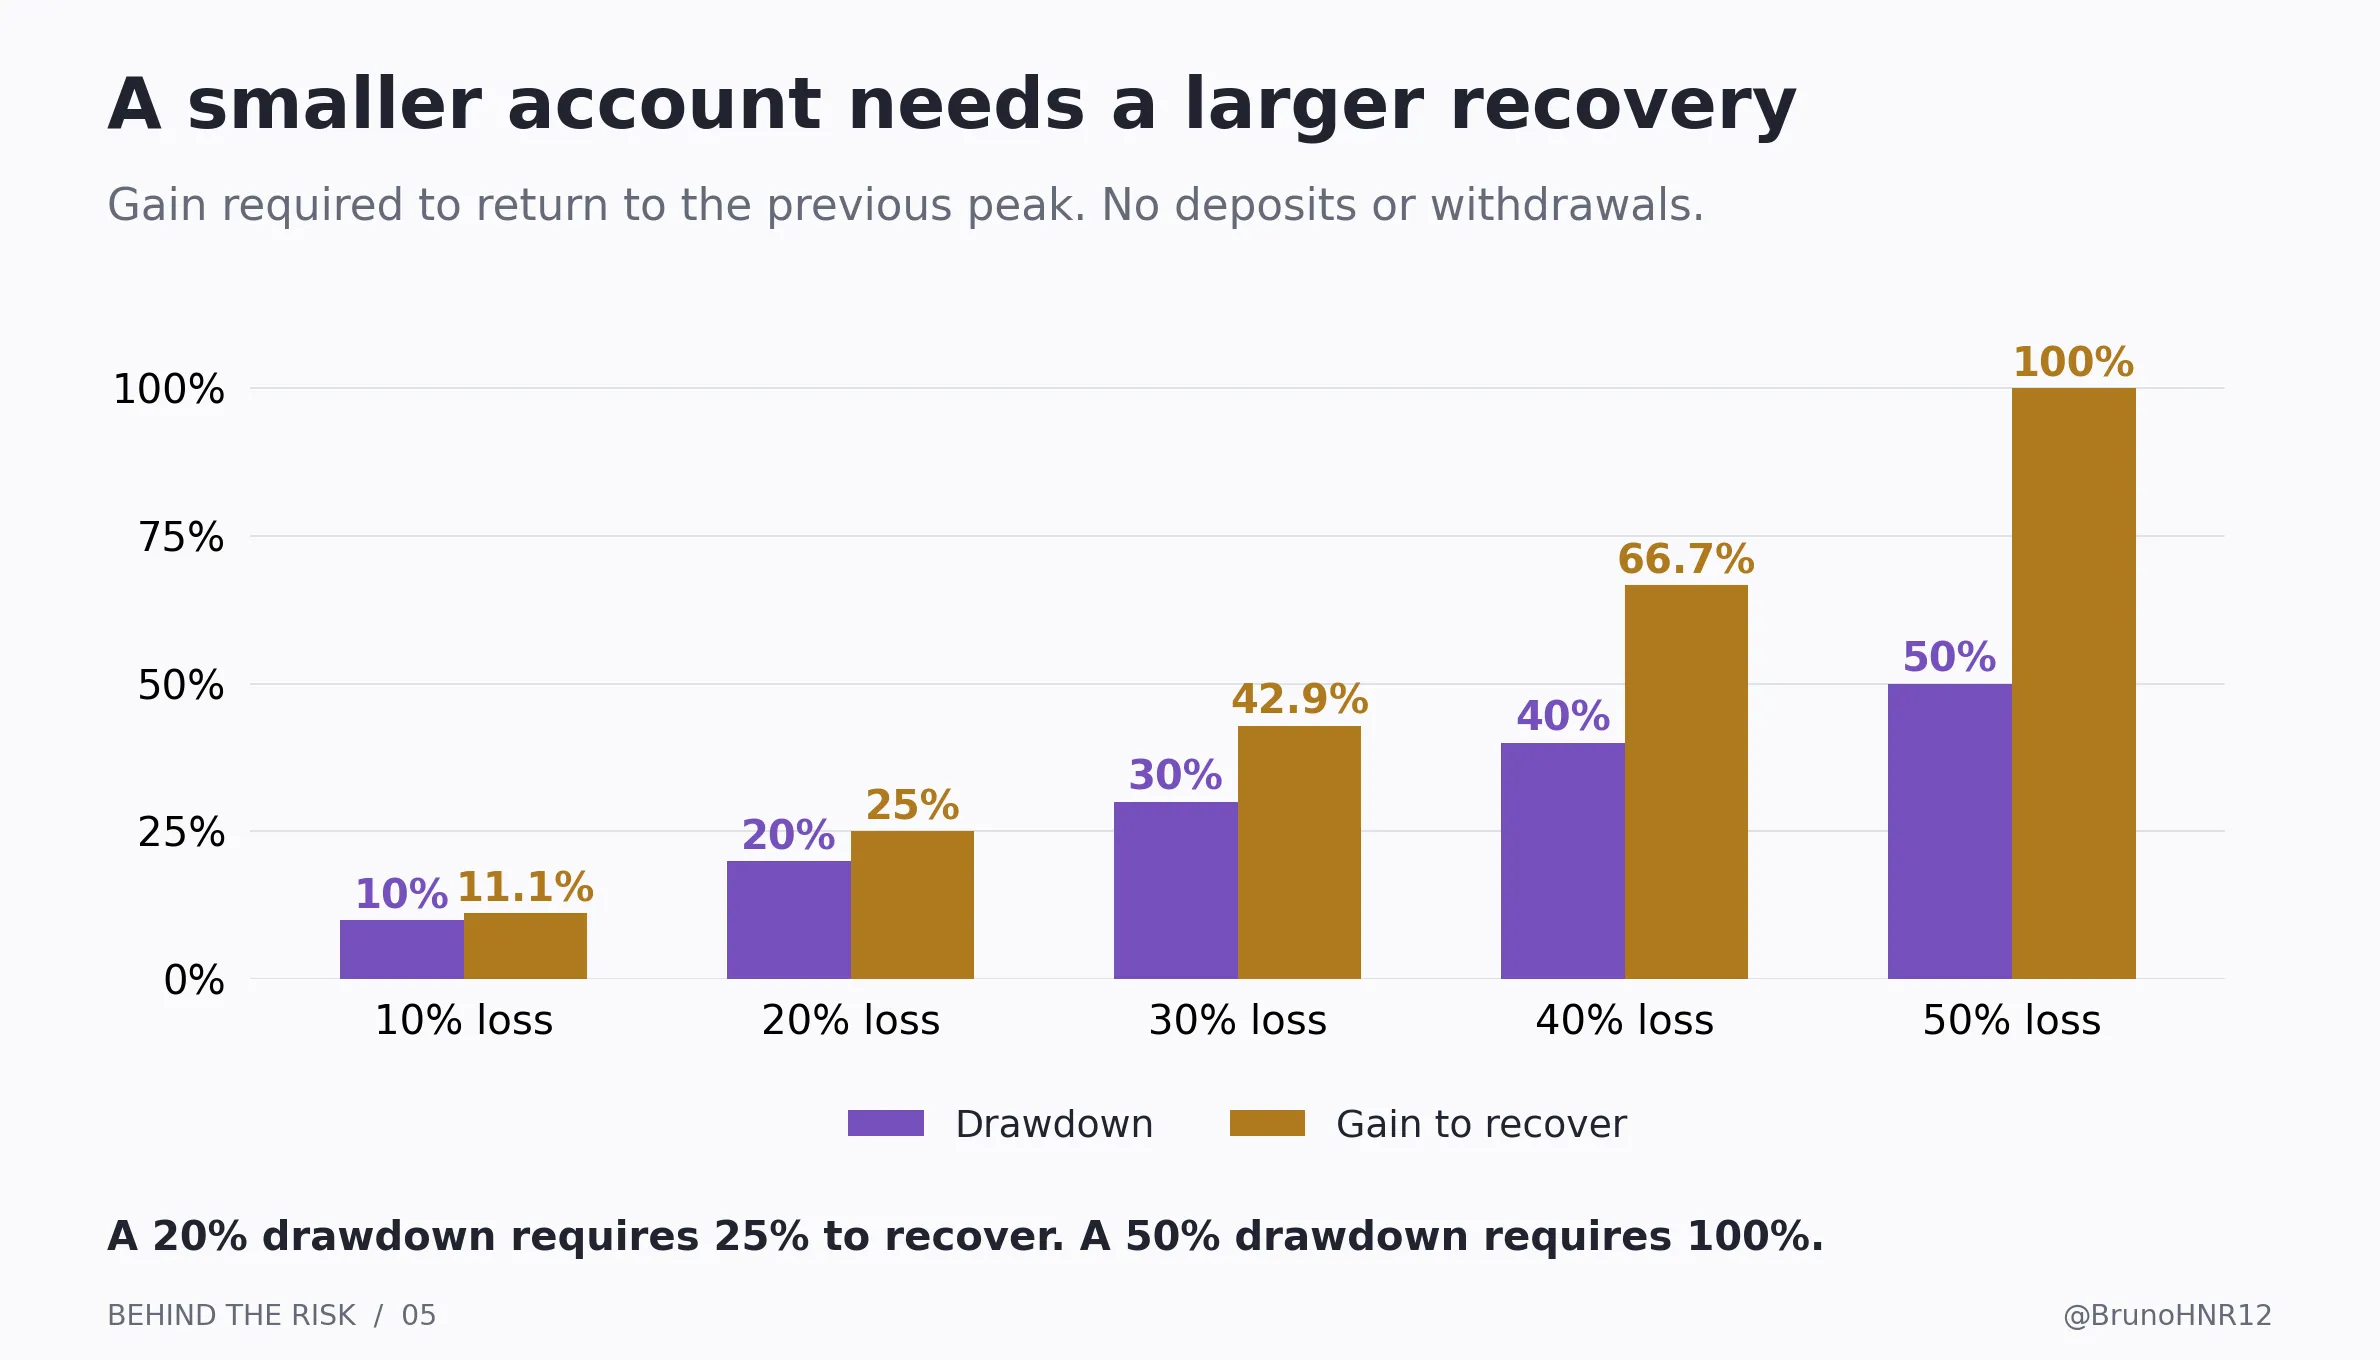
For a drawdown expressed as a decimal, the recovery fraction is the drawdown divided by one minus the drawdown. At a 20% drawdown, 0.20 divided by 0.80 gives 0.25.
Drawdown measures a decline from a previous equity peak. It can exist while the account is still above its original deposit. Maximum drawdown is the largest such peak-to-trough decline in the period and data being measured.
The measurement frequency matters. A closed-trade or end-of-day curve can miss a much larger intraday open loss. State whether your records use realized balance, end-of-day equity or continuously marked equity. Deposits and withdrawals also need separate treatment so they do not masquerade as trading performance.
These calculations do not justify chasing the recovery percentage. They show why the size of the decline matters before you take the next trade.
9 Additions change the risk of the whole position
Key takeaway
Adding only while a trade is profitable does not guarantee a profitable exit. Recalculate the combined entry, the total quantity and the result at the proposed exit.
Suppose you buy two MNQ at 25,000. The original stop trigger is 24,975. The initial price risk is $100: 25 points × $2 × two contracts.
The market rises to 25,030. The position now shows $120 of unrealized gross profit. You buy two more MNQ at 25,030, giving four contracts with an average entry of 25,015. Assume all stated entries and exits fill exactly and exclude fees for this section.
Keeping the original stop
If all four exit at 24,975, the first two lose $100 and the added two lose $220. The combined result is -$320.
The initial price risk was $100. Adding an equal number of contracts increased the potential loss at that unchanged stop to $320 because the new contracts entered farther away from it.
Moving the stop above the first entry
Suppose instead all four exit at 25,005. The first two make $20, but the added two lose $100. The combined result is -$80.
The stop is above the original entry, yet the overall trade still loses. The relevant average entry after the addition is 25,015.
- 24,975: First two MNQ: -$100. Added two MNQ: -$220. Combined gross result: -$320.
- 25,005: First two MNQ: +$20. Added two MNQ: -$100. Combined gross result: -$80.
- 25,015: First two MNQ: +$60. Added two MNQ: -$60. Combined gross result: $0.
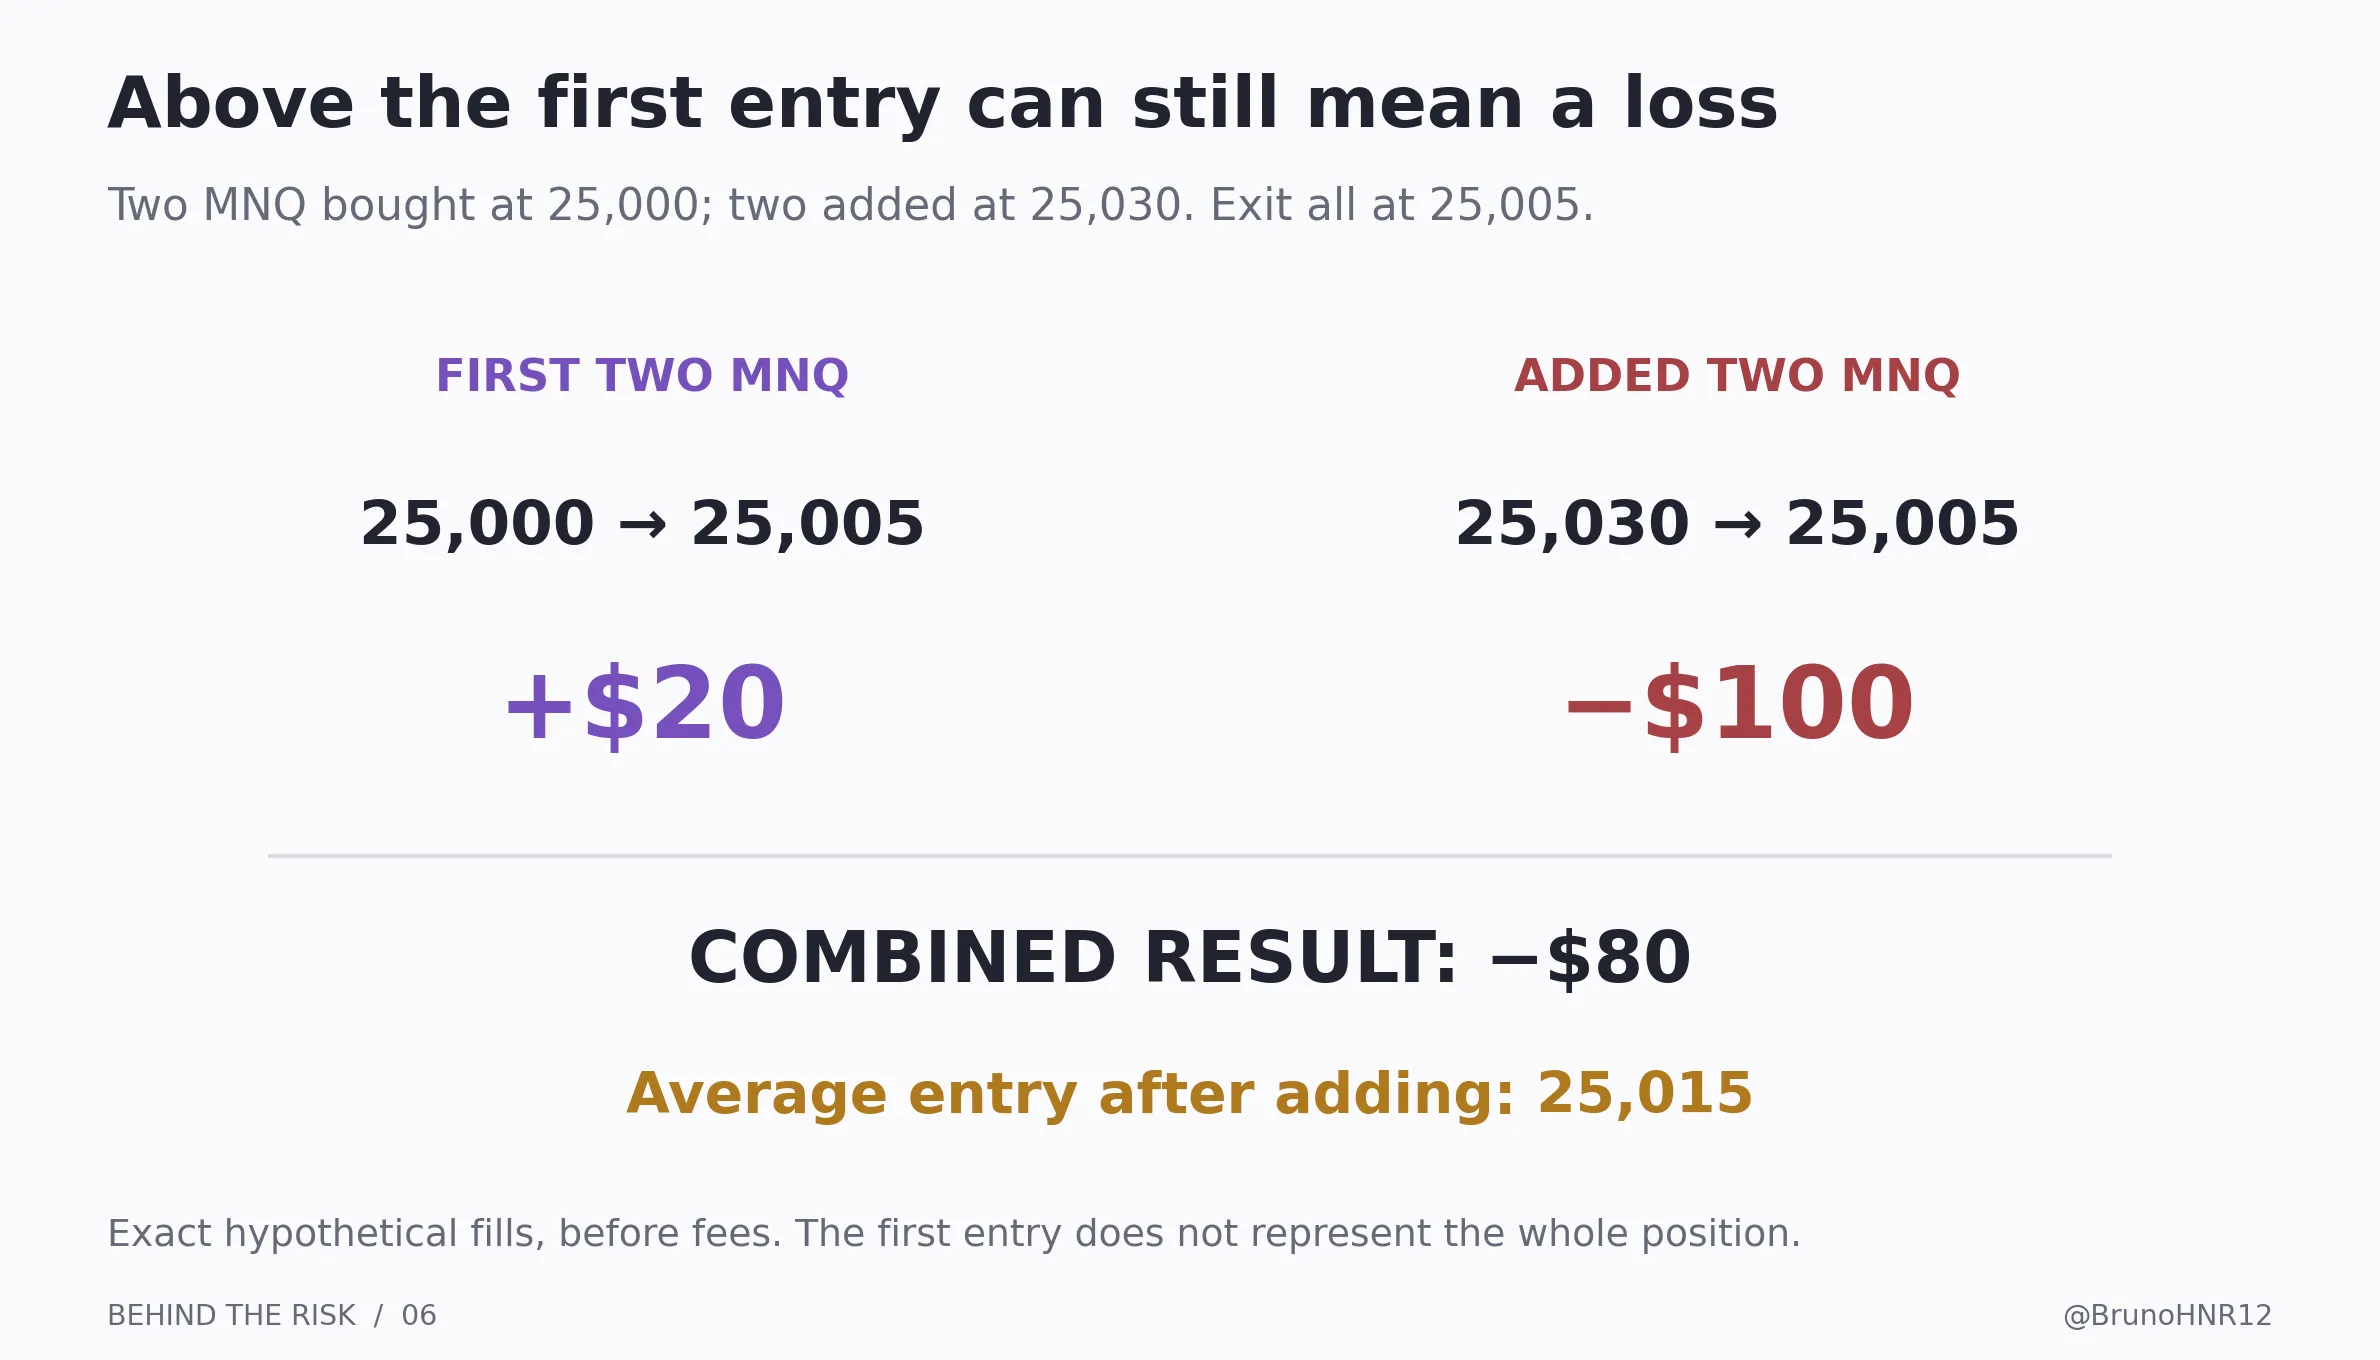
There are also two useful reference points for risk. At 25,030 the position has $120 of open gross profit. An exit at 25,005 changes that to an $80 gross loss. It gives back $200 of current marked equity, even though the final loss measured from the original account balance is $80.
An exact exit at the average entry gives zero gross price profit. Fees or an adverse fill can still make the net result negative. Calling that position risk-free would hide both execution risk and the open profit that could disappear.
The comparison explains consequences. It does not prescribe moving the stop to 25,005 or 25,015. A revised stop still needs a place in the tested trade-management rules.
Before an addition, calculate the proposed total position at its intended exit, including costs, and check whether the stop quantity covers the intended contracts. If entries have different stops, calculate each leg separately and combine the outcomes. Also check whether the account can tolerate the giveback from its current equity, which may matter more than the trade's original starting balance.
10 Manage the session as well as the individual trade
Key takeaway
Several trades can consume the same loss allowance. Budget for current exposure, new orders and losses already taken during the session.
Imagine a self-imposed daily loss budget of $300, measured from the day's starting equity. You are flat and down $180 net. There is $120 of room left under that personal rule. A new trade with a $150 estimated loss at its planned exit does not fit, even if $150 would normally be an acceptable per-trade amount.
Now suppose you already hold a position. Include what could happen to that open position from its current mark before allocating new risk. Adding only closed losses to the next trade's stop amount can miss a giveback of current open profit, as the previous example showed.
Pending entry orders matter too. If two breakout orders can both fill, calculate the resulting combined position. A hoped-for cancellation is not the same thing as a confirmed cancellation.
Holding NQ and gold at the same time also requires an account-level scenario. You cannot assume that the gold position will offset an adverse Nasdaq move. Their relationship can vary. Estimate the impact if both reach their adverse exits, then allow for execution differences. Adding the planned losses is a transparent stress case, not a probability forecast or a complete worst-case bound.
A daily stop rule should specify what it measures, what happens to open positions and pending orders, and whether the platform actually enforces it. A decision to stop initiating trades is different from a command to close existing positions.
It can help to distinguish two decisions: reducing exposure when a numerical budget is reached, and pausing because execution or behaviour no longer matches the plan. For example, repeatedly entering before the setup completes is observable. Labelling yourself undisciplined is much less useful for deciding what must change.
11 Funded account labels and usable loss room
Key takeaway
The account's headline size may be very different from the distance to its loss threshold. Understand which balance is monitored and how that threshold moves.
Consider a generic program described as a $50,000 account, currently allowing $2,000 of loss before its failure threshold. A $500 planned trade loss is 1% of the headline amount but 25% of that initial loss room. These percentages describe the same trade against different denominators.
That does not make the $2,000 equivalent to cash you own in a brokerage account. It describes a program constraint. Account access, contractual payout rights, your fees and your personal financial liability are separate questions.
A fixed floor stays at the same level unless a specific rule changes it. A trailing floor rises with a defined high-water mark and may stop rising at a specified level. An intraday trailing model can follow open equity highs; an end-of-day trailing model updates from the program's end-of-day reference. When the threshold updates and when breaches are monitored are separate rules.
A current Topstep example
Topstep's 50K Express Funded Account (XFA) is simulated, begins with a $0 balance, and initially has a Maximum Loss Limit (MLL) of -$2,000. Its 50K label describes buying power. [9, 10]
The MLL trails upward using end-of-day balances and stops at $0 once reached. Compliance is monitored during the session using realized and unrealized results. An intraday breach counts even if the eventual exit leaves the balance above the threshold. A first payout also sets the MLL to $0. These details were checked on 4 October 2026 and must be rechecked for the account and program being used. [9]
For a simplified illustration under those starting conditions, a $500 gain makes the balance $500 and the trailing floor -$1,500. A subsequent $500 loss returns the balance to $0, while the floor remains at -$1,500. The balance is back where it started, but available loss room has fallen from $2,000 to $1,500.
This is why a sequence matters. Subtracting a current threshold from the current monitored equity gives a useful snapshot of remaining room. It does not account for every future floor adjustment, fee or execution delay. Keeping a separate operating buffer avoids treating the failure threshold as the intended stop level.
Disclosure: I am a paid Topstep Ambassador. This example illustrates the calculation; it is not a comparison of programs or a promise of funding or payouts.
12 Build a risk plan you can actually use
Key takeaway
A useful plan connects a market decision to a dollar consequence and an action. It needs to remain workable when the trade is moving against you.
Before entering, be able to answer these questions without changing the assumptions midway through the calculation:
- What exact contract and expiry am I trading, and what is its dollar sensitivity?
- What entry and invalidation level does the setup require?
- What quantity fits after the relevant fees and execution allowance?
- What would a materially worse fill do to the account?
- How much of today's budget and the account's remaining loss room is already committed?
- If I add, what happens to the whole position at the revised exit?
- What specific condition makes me reduce exposure, close positions or stop trading?
After the trade, compare the plan with the fills. Record the initial R, all entries and exits, charges, any size changes, and the largest adverse movement while the position was open. Note whether a loss came from the planned setup failing, unexpected execution or a departure from your rules. Those lead to different corrective actions.
Over a sequence of trades, review net expectancy, drawdowns, losing streaks and dependence on a few exceptional winners. Examine whether the results change by session or market condition. Simulated fills and a small favourable sample are not enough to establish how a larger live position will behave.
Risk and behaviour also meet at a practical question: can you repeatedly execute the plan at this size? If you start moving stops or taking profits far earlier than your rules require, document when that happens. Smaller size may make the process easier to follow, but it does not repair an untested setup.
The goal is to know the consequence of the decision before committing to it. A trade can lose while following a sensible plan. A trade can win after an unjustified increase in risk. The immediate result alone does not tell you which decision was repeatable.
Check your understanding
One MNQ or one NQ: A 30-point adverse move costs how much before fees? One MNQ loses $60; one NQ loses $600.
Quantity: A $180 budget and an estimated $47 total loss per contract allow how many contracts? Three, with $141 planned. Four would require $188.
Recovery: A $10,000 account falls to $7,500. What gain restores it? About 33.3% on the remaining equity, assuming no cash flows.
Adding: Two MNQ at 25,000 plus two at 25,030 exit at 25,005. Does the trade make money because the stop was above the first entry? No. The combined gross loss is $80.
Funded loss room: Is risking $500 on a 50K label necessarily small? The label is insufficient. If remaining room is $2,000, that trade uses 25% before any unexpected cost.
The question to keep beside your chart
Before the next entry or addition, finish this sentence:
If this position exits at my planned level, including my cost assumptions, the account loses ____. If execution is worse, my stress scenario is ____. After that, the remaining room is ____.
If those blanks are unclear, calculate them before deciding the quantity.
What changed your trading most: reducing size, understanding drawdown, or learning to manage the whole position? ~
Sources and calculation notes
The sources below support contract specifications, order handling and the dated account example. All trade examples, comparison paths and arithmetic are constructed for this article. They do not represent measured market performance. The risk budgets are illustrative, not individual trading recommendations.
[1] CME Group. E-mini Nasdaq-100 futures specifications. NQ multiplier and outright tick size.
[2] CME Group. Micro E-mini Nasdaq-100 futures specifications. MNQ multiplier and outright tick size.
[3] CME Group. Gold product overview. GC and MGC contract quantities and tick values.
[4] CME Group. Margin Know What Is Needed. Futures margin, initial and maintenance requirements, changes and liquidation.
[5] National Futures Association. Investor Best Practices. Futures leverage, risk capital and possible account deficiencies.
[6] CME Group. Proper Position Size. Connecting stop distance with a dollar budget. This article does not adopt a universal percentage recommendation.
[7] CME Group. Glossary. Entries for Stop Limit Order, Stop With Protection and Market Order With Protection.
[8] CME Group. The Mathematics of Trading Success. Win frequency and average win and loss size. Our numerical comparisons are separate illustrative models.
[9] Topstep Help Center. What is the Maximum Loss Limit. Trailing calculation, intraday monitoring and the cited 50K XFA example. Checked 4 October 2026.
[10] Topstep Help Center. Express Funded Account Parameters. Simulated XFA status and starting balance. Checked 4 October 2026.
Calculation note on losing streaks: The 81.0% figure uses an exact recurrence for 100 independent trials, each with loss probability 0.5. Track five states representing zero through four consecutive losses without having reached five. A win resets the run to zero; a loss increases it by one. A loss from the state representing four consecutive losses reaches the event being counted. One minus the total probability remaining in the five states after 100 trials is 0.8101095992. This is a model calculation, not an estimate from trading records.
Calculation note on equity paths: Each fixed-fraction path is $10,000 multiplied by the remaining equity fraction once for each loss. The recovery percentages divide the amount lost by the remaining balance. The examples exclude cash flows and assume the stated execution, costs and sizing conditions. Displayed values are rounded after calculation.
Understand the risk. Execute your plan.
You know your rules, but struggle to follow them during a session? Individual coaching focuses on your performance, decisions and the obstacles you face. Sessions are available in French or English; English is not my native language.