
STRATEGY & EVIDENCE · FUTURES
Behind the EdgeIs your trading strategy actually working?
The evidence behind a trading method, from costs and uncertainty to testing without hindsight.

Eight educational charts. All examples are hypothetical or simulated, not a trading track record.
You finish the month in profit. The entries look clean. Your best trades seem to confirm everything you believe about the market.
How much of that result can you reasonably expect to repeat?
That question connects the previous articles in this series. Behind the Candles explained how futures prices move and how orders become executions. Behind the Risk explored what those executions can do to an account. This article examines the evidence behind the decisions themselves.
An attractive chart can start an investigation. Confidence has to come from how a method was defined, how it was tested, what its results include, and what happens when it encounters information it has never seen.
The examples below concern the evaluation of futures trading methods, especially the kind of intraday decisions an NQ or GC trader makes. Every numerical example and chart is hypothetical or simulated. None represents my trading record, a market forecast, or a verified profitable strategy.
The article in two minutes
- Define the decision before measuring the result. A setup needs clear entry, exit, context and exclusion rules.
- Use net results. Fees, missed fills and execution differences can consume a small apparent advantage.
- A sample contains uncertainty. More trades help, but repeated exposure to one market condition is limited evidence.
- Track every version you tried. The best result from a large search can be a lucky result.
- Protect genuinely new information. Once you use a test result to improve the rules, that test has become part of development.
- Separate process from outcome. A profitable rule violation and a planned loss teach different lessons.
- Let the evidence remain incomplete. “Promising, but not established” is a useful conclusion.
1 What a trading edge actually means
Key takeaway
An edge is a favorable expected result after costs, under specified conditions. A profitable sample is evidence to examine, not a direct measurement of what the future owes you.
Imagine repeating a decision many times in comparable situations. Some attempts win, some lose, and the amounts differ. An edge would mean that the average net result of that decision is positive under those conditions. CME's educational treatment of mathematical expectation makes the essential connection between the frequency of outcomes and their size. [1]
Expected does not mean guaranteed. It also does not mean that a trader must earn a fixed amount every day. The expectation is a property of a process under assumptions; the result is what happened in one particular sequence.
Three things therefore deserve separate names:
- An idea: “A breakout might continue when participation increases.”
- A method: The rules that decide which breakout qualifies, when to enter, how to exit and when to stay out.
- Evidence: The observations collected when those rules are applied, including losing trades and inconvenient sessions.
An explanation can sound convincing without producing profitable trades. A pattern can also look profitable in a small sample without having a convincing explanation. Both situations deserve investigation.
A plausible reason for a pattern is helpful because it suggests what to measure and when the pattern might fail. It does not replace a test. “Buyers were aggressive” is a description; whether a specific entry after that observation has useful net results remains a separate question.
For readability, this article uses R as a unit of planned initial price risk. If that amount is $100, a net gain of $150 is +1.5R. Keep the initial denominator fixed for that trade, even if the stop moves. A stop is not a guaranteed maximum loss, and a realized loss can exceed 1R. The risk article covers those mechanics in detail.
2 Turn a setup into something you can test
Key takeaway
Someone should be able to understand why a trade qualified using only the information available before entry.
“I take strong breakouts” leaves several decisions undefined. How strong? Above which level? At what time? What makes a breakout invalid? Those gaps allow a trader to recognize winners after the fact and quietly reject losing examples.
Here is an intentionally simple research rule card, using NQ as the example. These parameters are arbitrary teaching choices, not my personal strategy or trading recommendations.
- Market and data: One specified NQ contract, standard one-minute candles, New York local time with daylight-saving changes handled correctly. Record the data feed and contract-selection rule.
- Reference: The highest traded price from 09:30:00 through 09:44:59.
- Trigger: The first completed one-minute bar after that reference period that closes above the reference-period high. A signal must be confirmed before 10:30.
- Entry: A simulated market buy on the next available tick after confirmation. Do not silently assume execution at the signal bar's closing price.
- Exit: A stop 20 points below the recorded entry and a target 40 points above it. Close any remaining position at 11:00. One trade at most per session, with no additions or partial exits in this research version.
- Exclusions: Before testing, identify full sessions to exclude because of scheduled CPI, US employment-report or FOMC decision dates. Record missing-data sessions separately. Preserve the excluded-session list and the reason for every exclusion.
For implementation, document costs, fills, gaps and simultaneous events. Section 7 explains how these choices can change a test.
This example is deliberately narrow. A profitable result would apply to this version, its data and the tested conditions. It would not establish that every NQ breakout works, that short entries behave the same way, or that the rules transfer to gold.
Discretionary trading can still be evaluated. Save a screenshot and a short explanation before the outcome is known. Use a small, stable checklist for the judgments you make. If “clean structure” matters, describe the visible features that qualify and retain borderline cases. Reviewing charts with future bars hidden helps reveal whether your classifications are repeatable.
The point is to make the decision auditable. Changing your interpretation after seeing the exit changes the experiment.
3 Measure what reaches the account
Key takeaway
A method has to survive the difference between attractive theoretical prices and executable net results.
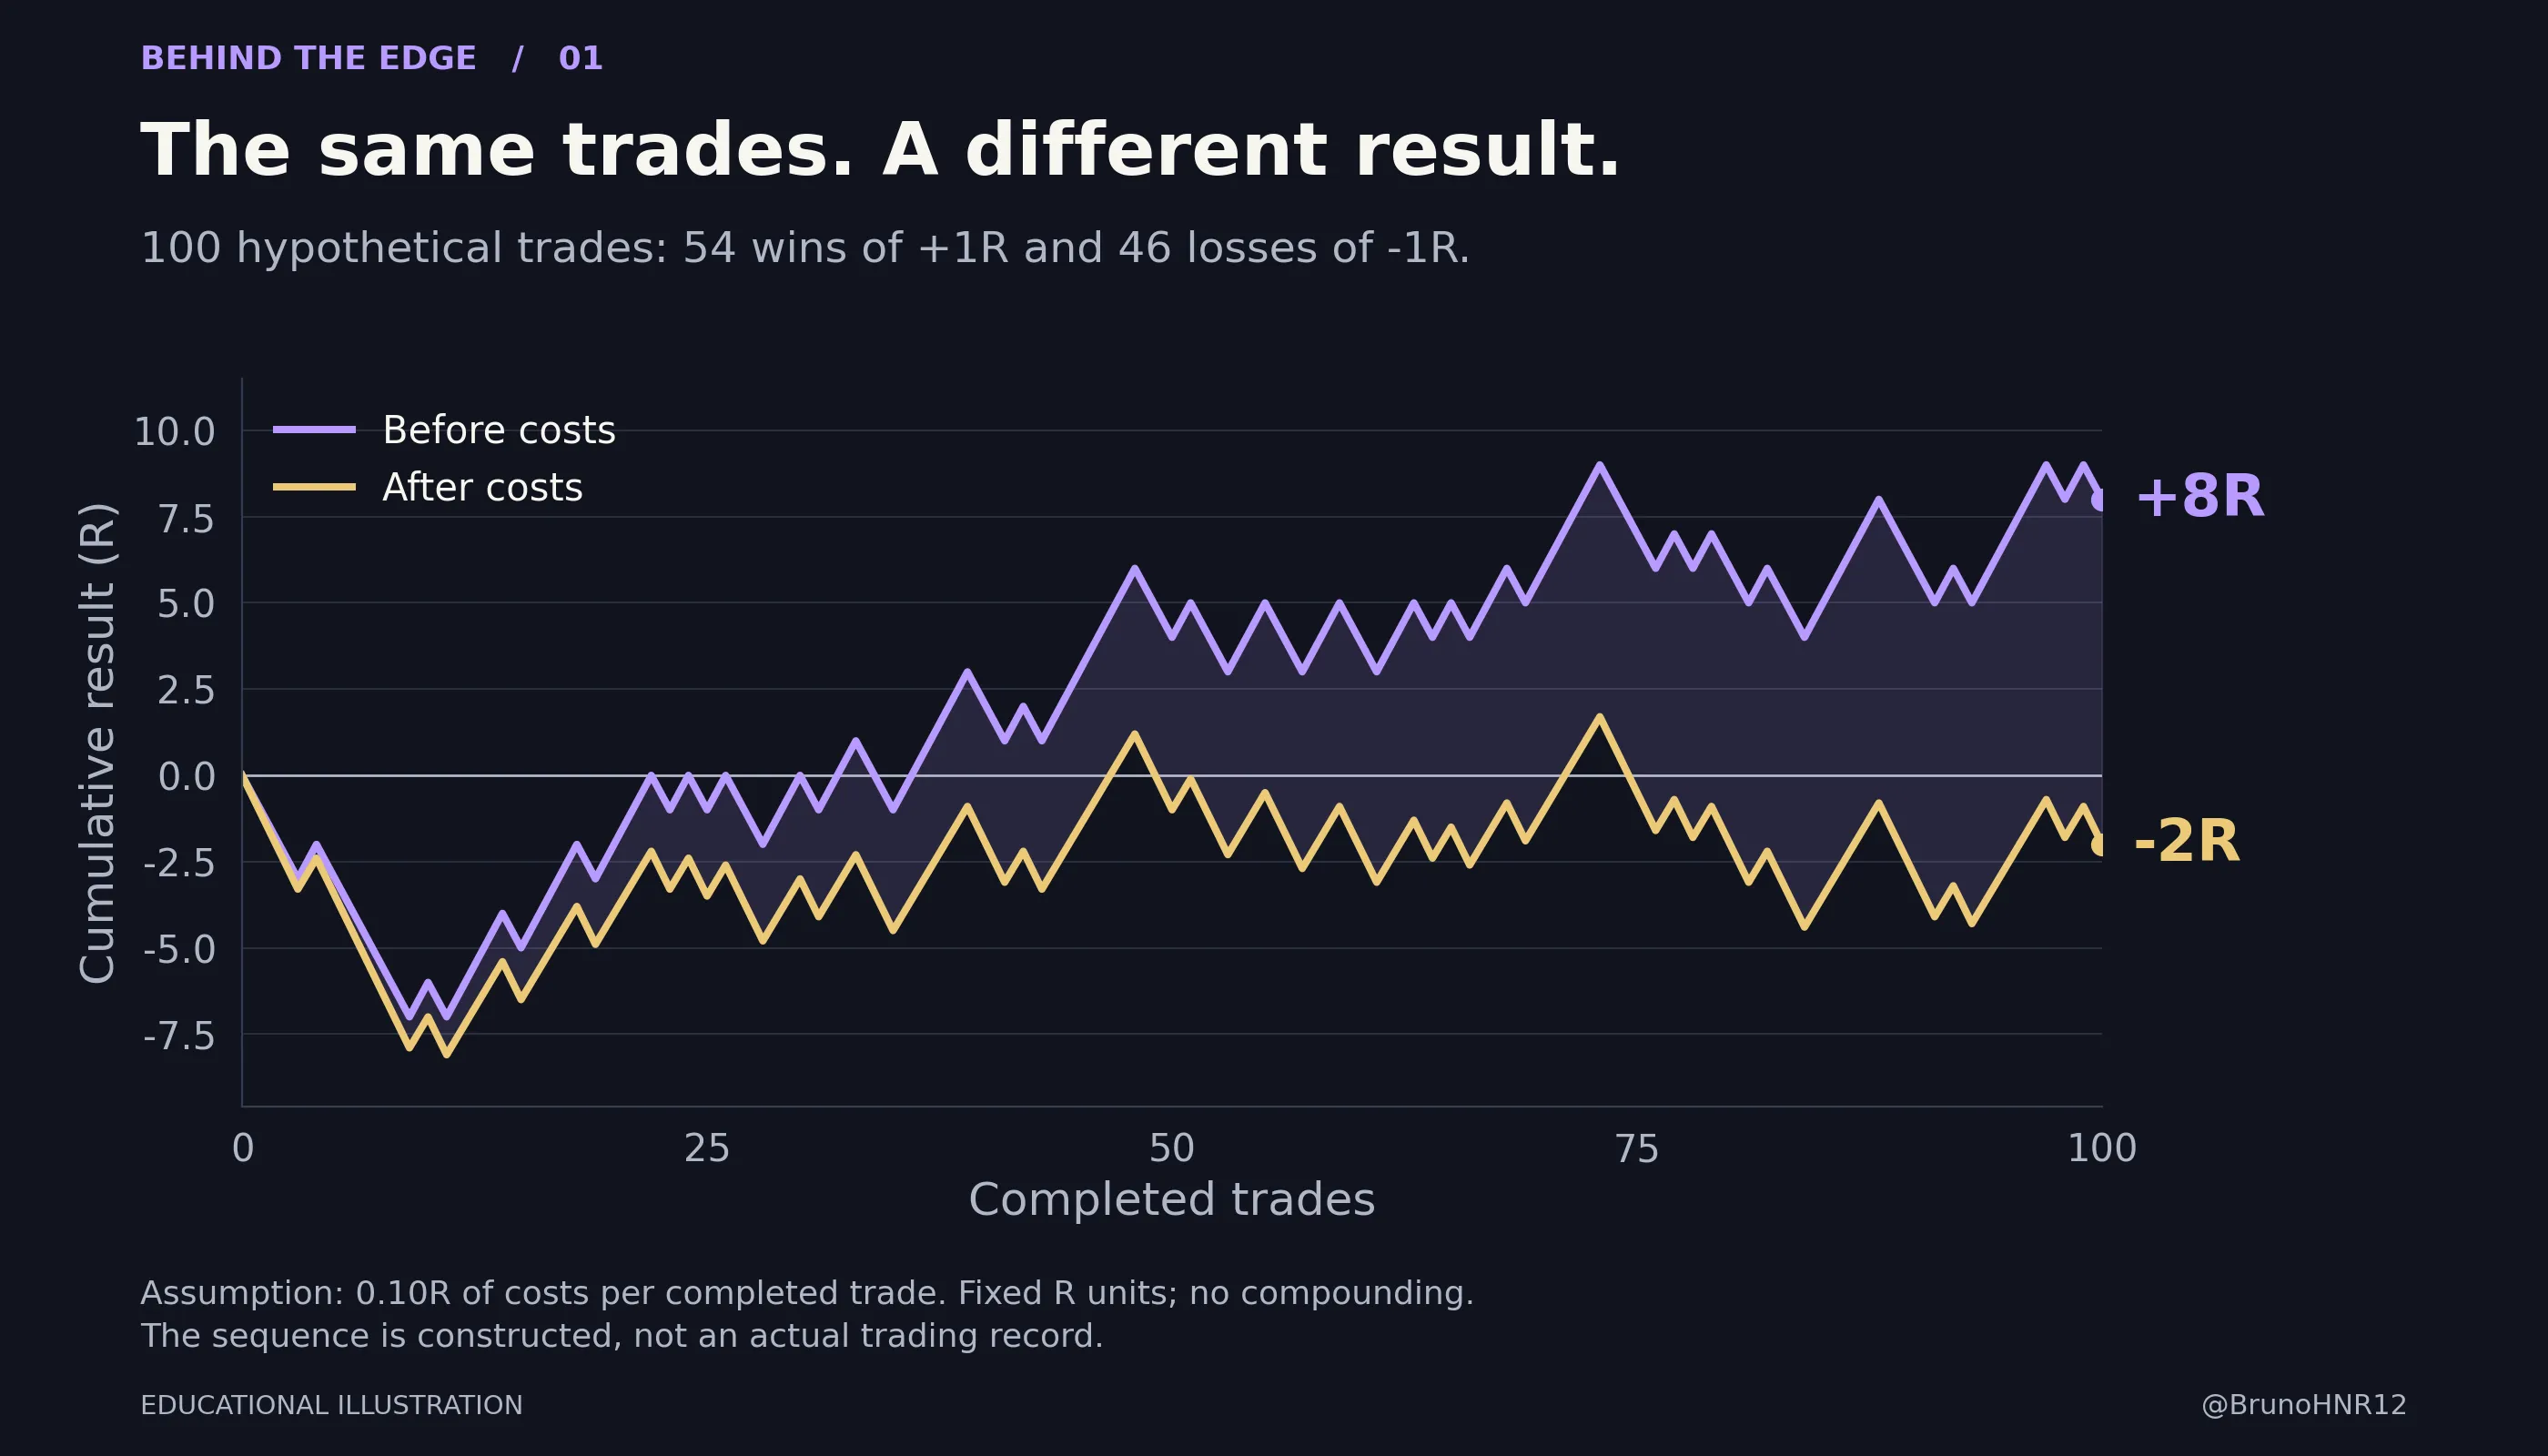
Consider 100 hypothetical trades: 54 winners of +1R and 46 losers of -1R. Their gross total is +8R. Assume a combined cost of 0.10R per completed trade. The total cost is 10R, leaving -2R net, or -0.02R per trade.
The gross curve in Figure 1 ends above zero. The net curve uses exactly the same trade outcomes and ends below it.
That assumed cost is an illustration, not a broker quote. For scale, one MNQ has a value of $2 per index point. A 25-point initial price-risk distance is therefore $50 per contract; a hypothetical $5 combined round-trip friction would be 0.10R. Actual charges and execution differences depend on the product, order, broker and conditions. [2]
For a backtest starting from ideal signal prices, model commissions and fees plus an appropriate execution allowance. For a journal starting from actual entry and exit fills, spread crossing and slippage are already reflected in those prices. Subtract the applicable explicit charges, without deducting the same execution effect twice.
Also reconcile the journal with account statements. Partial fills, multiple exits and additions belong to a consistent trade definition. Splitting one position into five exits does not create five independent trading decisions.
Keep fixed business expenses, such as data subscriptions, visible in a separate reconciliation to the overall business result. A method can be positive after variable trading costs and still fail to cover those overheads at the frequency you trade.
Finally, compare like with like. If contract quantity changes, a rising dollar curve may partly reflect greater exposure. Track net R alongside dollar results and position size. The R series still needs consistent definitions, and it does not describe account-level risk by itself.
4 Understand how uncertain a sample can be
Key takeaway
There is no universal number of trades that proves an edge. Sample size matters together with variability, dependence, market coverage and the amount of searching you did.
Suppose three records all show a 60% win rate. One contains 12 wins out of 20 trades, another 60 out of 100, and the third 300 out of 500. The headline percentage is identical. The precision is not.
Figure 2 uses approximate 95% Wilson confidence intervals for those hypothetical counts. Under a model of independent trades with the same underlying probability of winning, the intervals are approximately 38.7% to 78.1%, 50.2% to 69.1%, and 55.6% to 64.2%. [3]
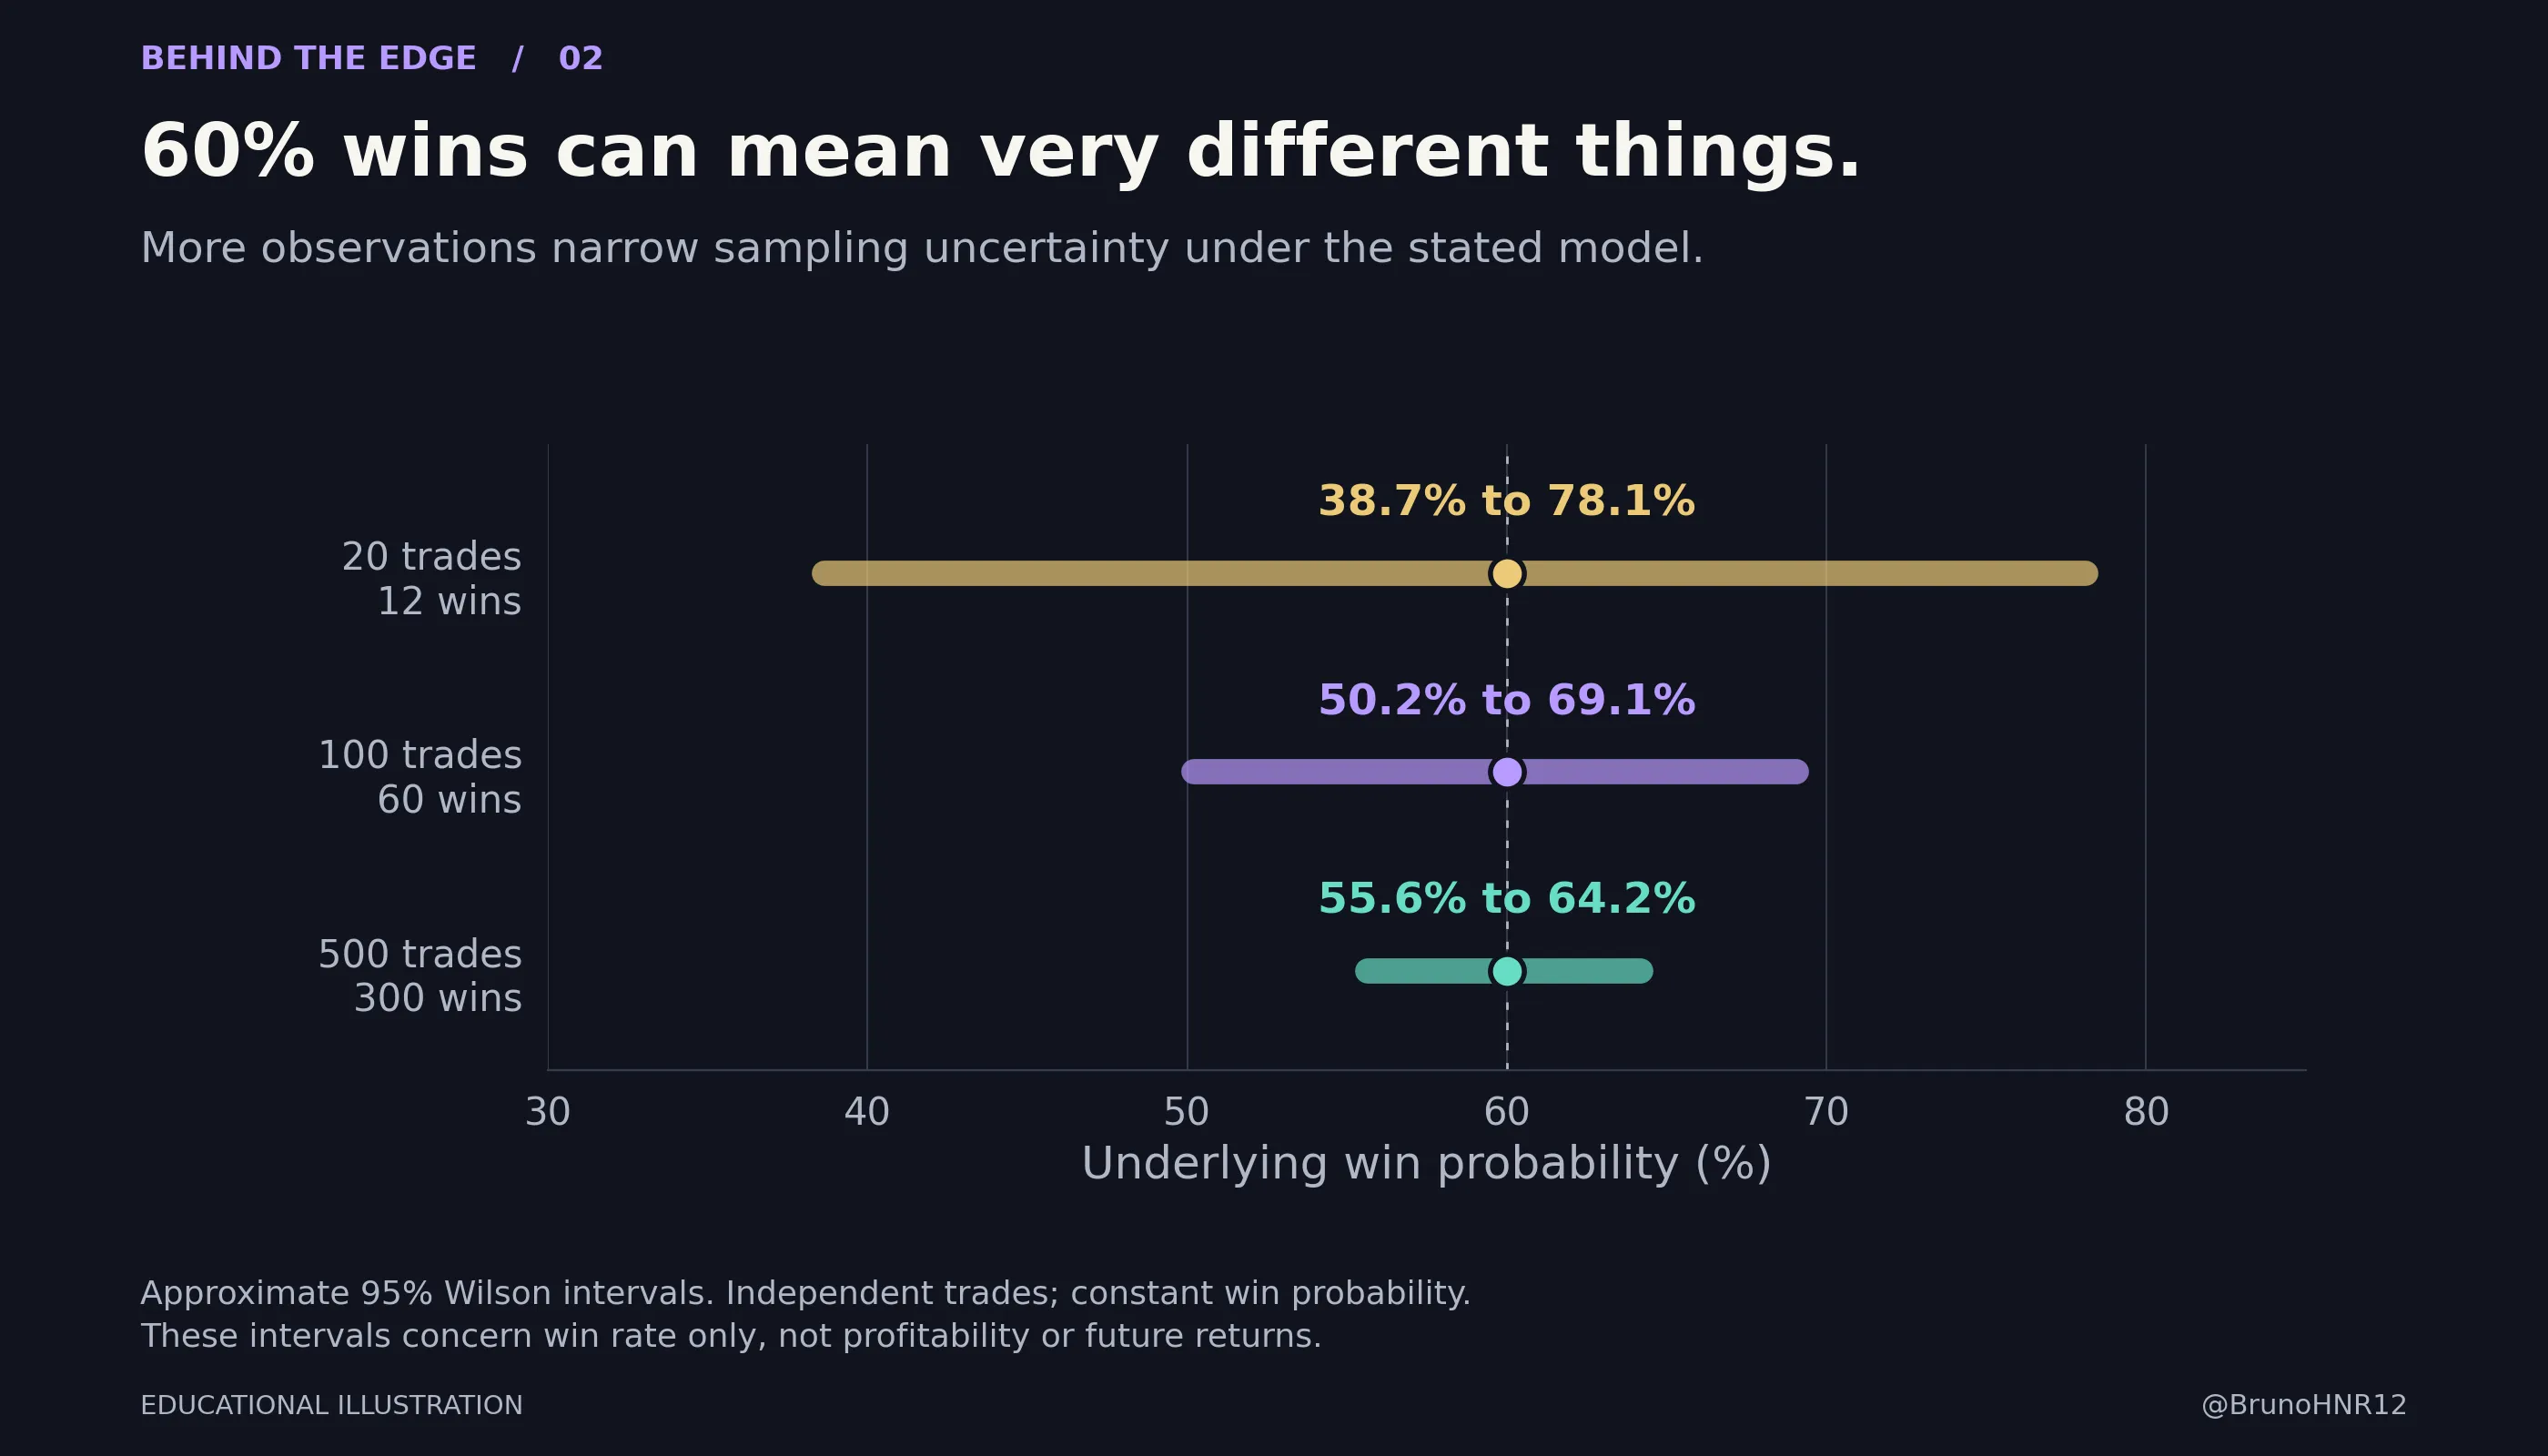
A confidence interval is a way to express estimation uncertainty. Its 95% label describes the long-run coverage of the procedure under its assumptions. It is not a statement that this particular strategy has a 95% chance of making money. [4]
And win rate is only one ingredient. These intervals say nothing about the size of wins, the size of losses or trading costs. A narrow interval around an unprofitable payoff structure is still unhelpful.
The assumptions also deserve attention. Several entries during one trend can share the same underlying market episode. Ten accounts copying one trade produce ten account records, but only one independent decision. NQ and MNQ positions taken on the same signal are closely connected observations, not a free multiplication of evidence.
Statistical methods that assume independent observations can misstate uncertainty when outcomes are dependent. NIST discusses why checking time dependence matters before applying common statistical formulas. [5]
For a practical review, count trades and sessions, show the calendar span, and inspect whether results cluster around a few events. More advanced analysis can group observations by session or use an appropriate block-resampling method to preserve some dependence. Neither technique can supply market conditions absent from the original data.
If a strategy has very occasional large winners, substantial variation in costs or changing conditions, estimating its average net result may require much more evidence than its win-rate percentage suggests. A calendar deadline or a round number such as 100 trades cannot resolve that uncertainty automatically.
5 Look inside the total profit
Key takeaway
Ask which trades and conditions created the result. Profit concentration is something to understand, not something to erase from the record.
A hypothetical journal ends at +15R after 100 trades. That sounds straightforward until you discover that the three largest winners contributed +20R, while the other 97 trades contributed -5R.
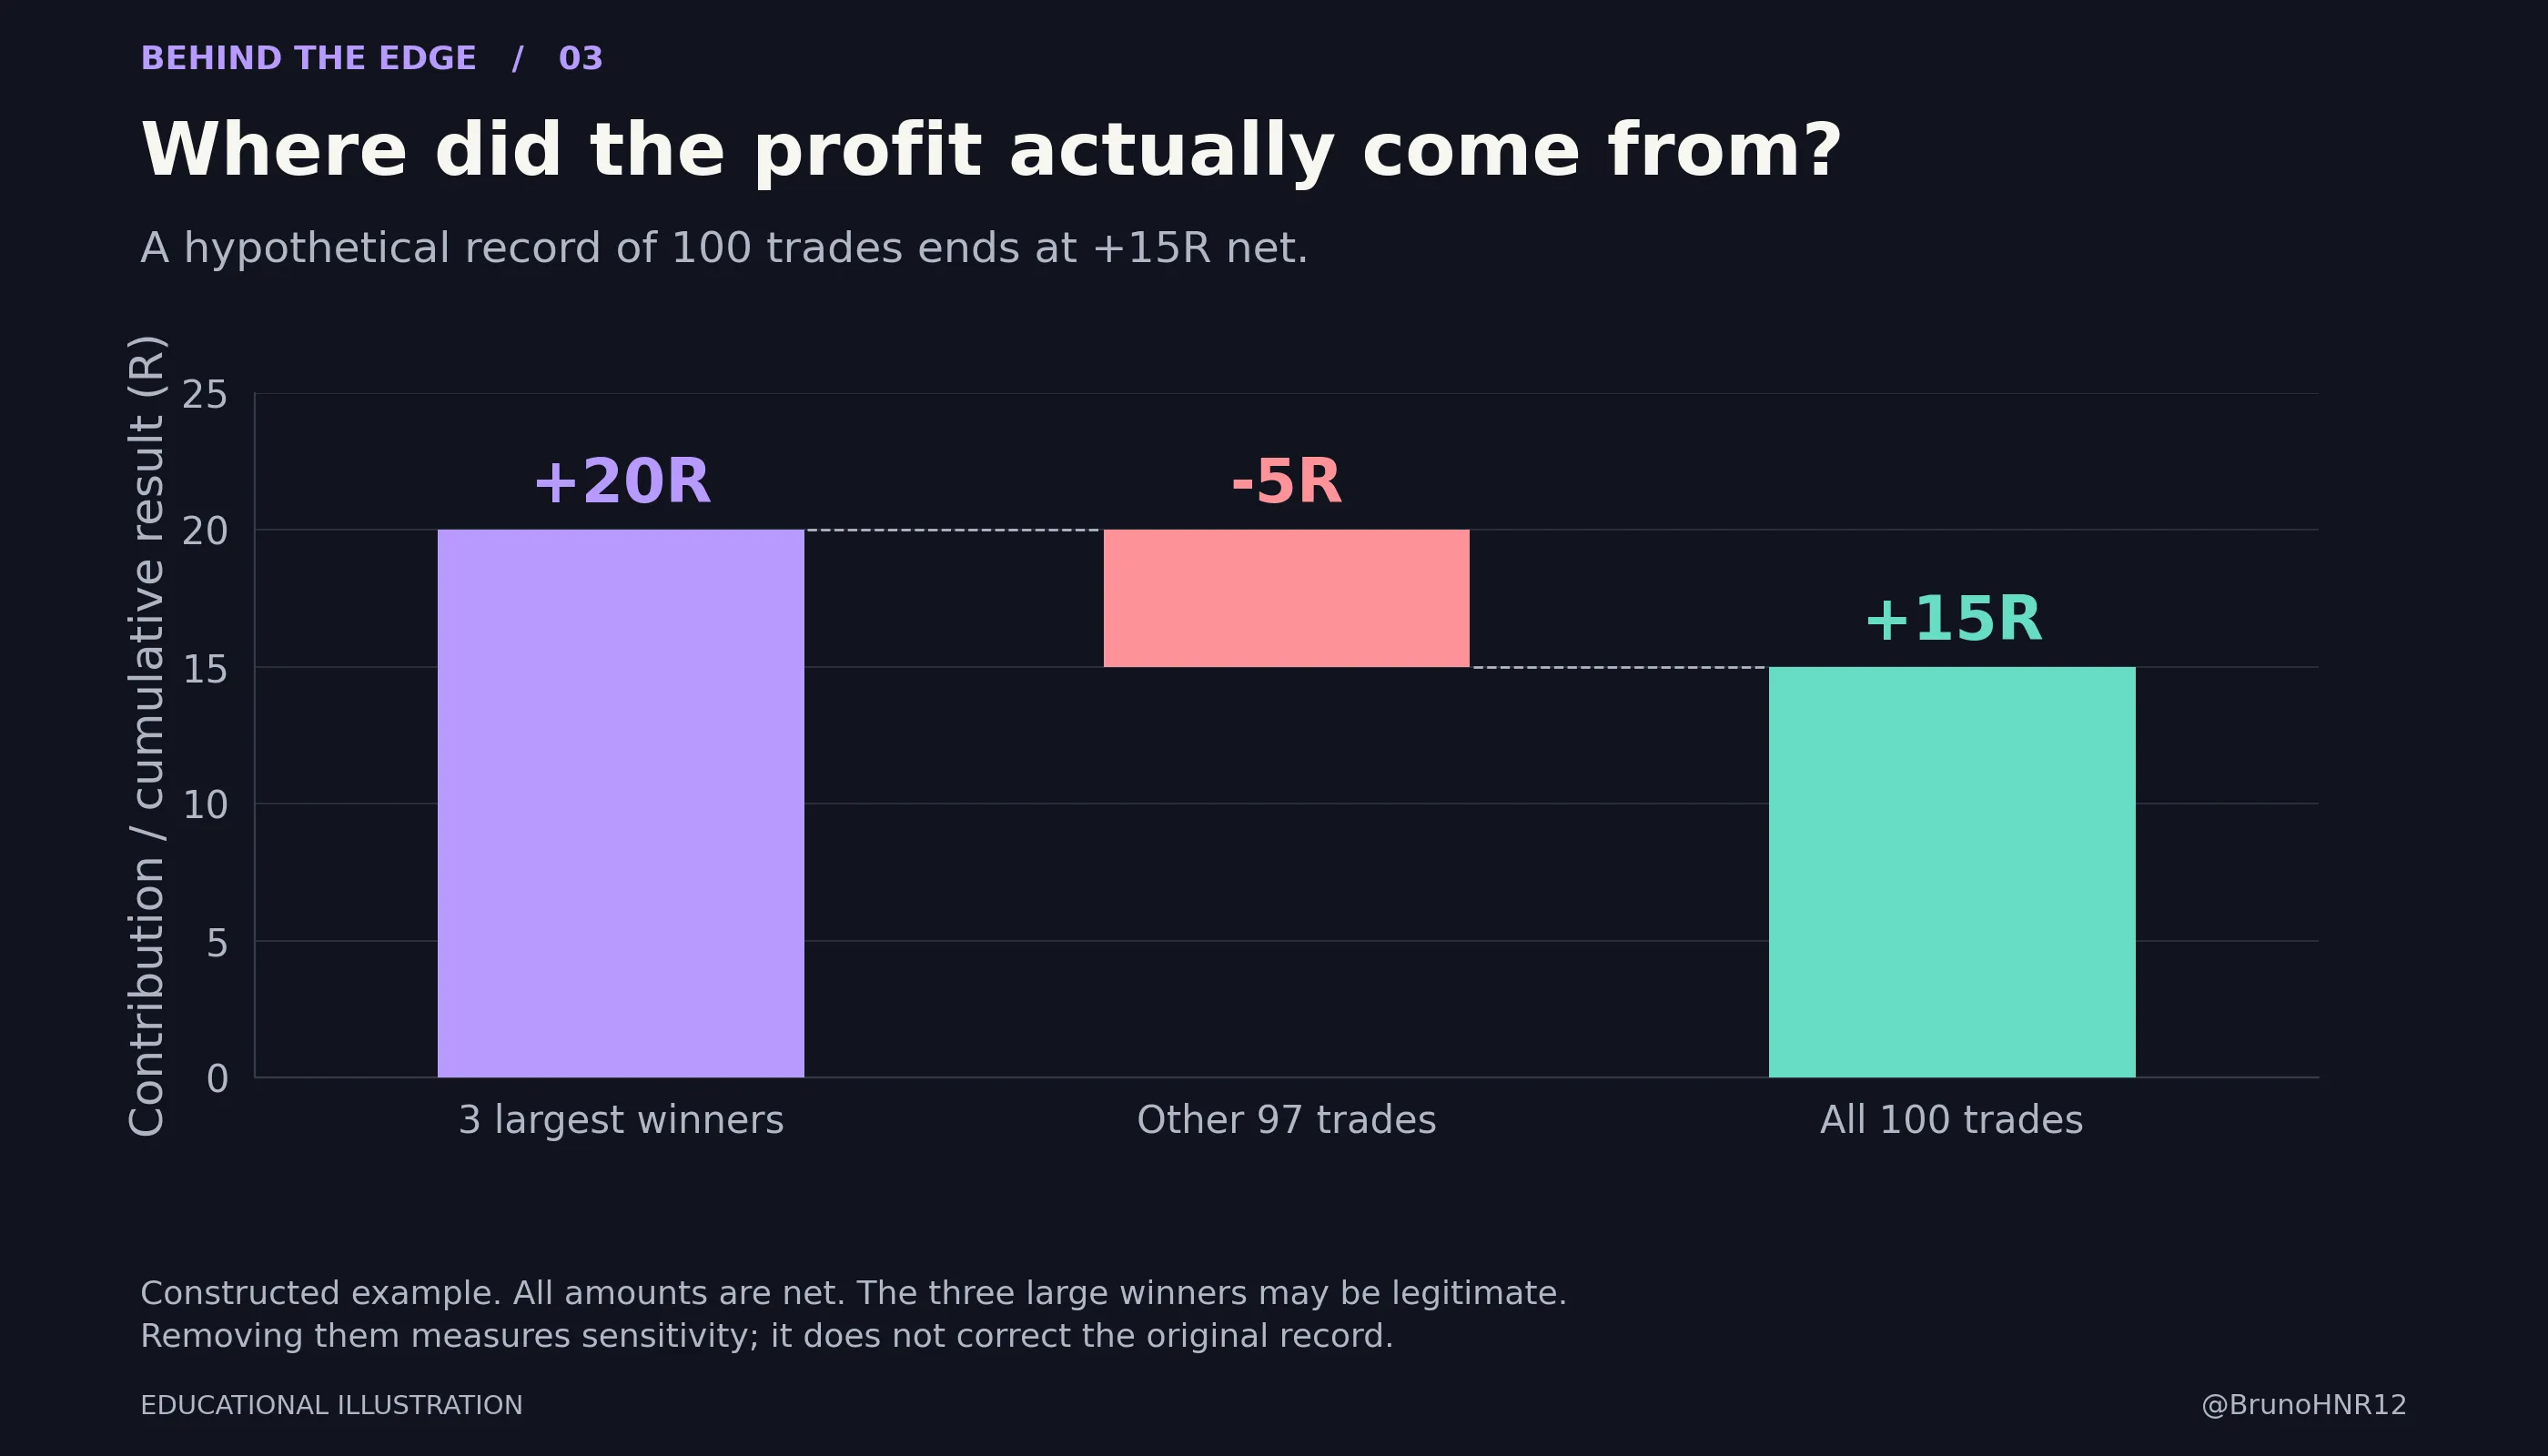
This pattern does not automatically make a strategy bad. A method designed to capture occasional extended moves may naturally depend on a small number of large wins. Deleting them would remove part of the behavior the method seeks.
The useful questions are more specific. Were those winners valid under the original rules? Could the exits realistically have been executed? Did they occur on sessions you normally refuse to trade? Would your actual management rules have allowed you to stay in the move?
The distinction matters for traders who avoid announcements. If nearly all simulated profit comes from holding through releases that your plan excludes, the test is describing a different activity. You cannot retain that profit while claiming the benefit of avoiding those periods.
Inspect performance by a few meaningful categories chosen before evaluation: long versus short, session, volatility condition or setup version. Include the count and total net result for each category. Five profitable trades in a subgroup should remain visibly different from 200 observations.
Be careful with labels such as “trending day.” A day can look obviously directional after the close. A usable entry filter must rely on information available at the decision time. Otherwise, the filter benefits from knowledge of the future.
Every new subgroup you inspect is also another chance to discover an accidental pattern. If Tuesday mornings look excellent only after you searched every hour and weekday, treat that finding as a new hypothesis. Test it on new information before presenting it as an established improvement.
6 The science of finding patterns in noise
Key takeaway
Selecting the best historical result changes what that result means. Keep the search history, including the versions that failed.
Think of students practicing with an answer sheet. A perfect score on those questions does not tell you how well they will answer new questions. In a backtest, a similar problem appears when settings are repeatedly adjusted to fit the same historical outcomes.
This is overfitting: adapting a method too closely to the particular sample, including its random features. Research by Bailey, Borwein, López de Prado and Zhu examines how testing many configurations can produce impressive historical performance even when the apparent discovery does not generalize. [6, 7]
The search can be manual. Changing the trading window, deleting a difficult month, trying another stop distance and switching the instrument are all additional choices. You do not need an optimization program to fit the past.
To make the problem visible, Figure 4 simulates 100 methods with no gross edge by construction. Each trade independently gains or loses 1R with equal probability. A cost of 0.05R is then deducted, so every method has an expected net result of -0.05R per trade.
After 200 trades, we select the method with the highest accumulated net result. We then follow that same method for 200 new simulated trades, without changing the selection.
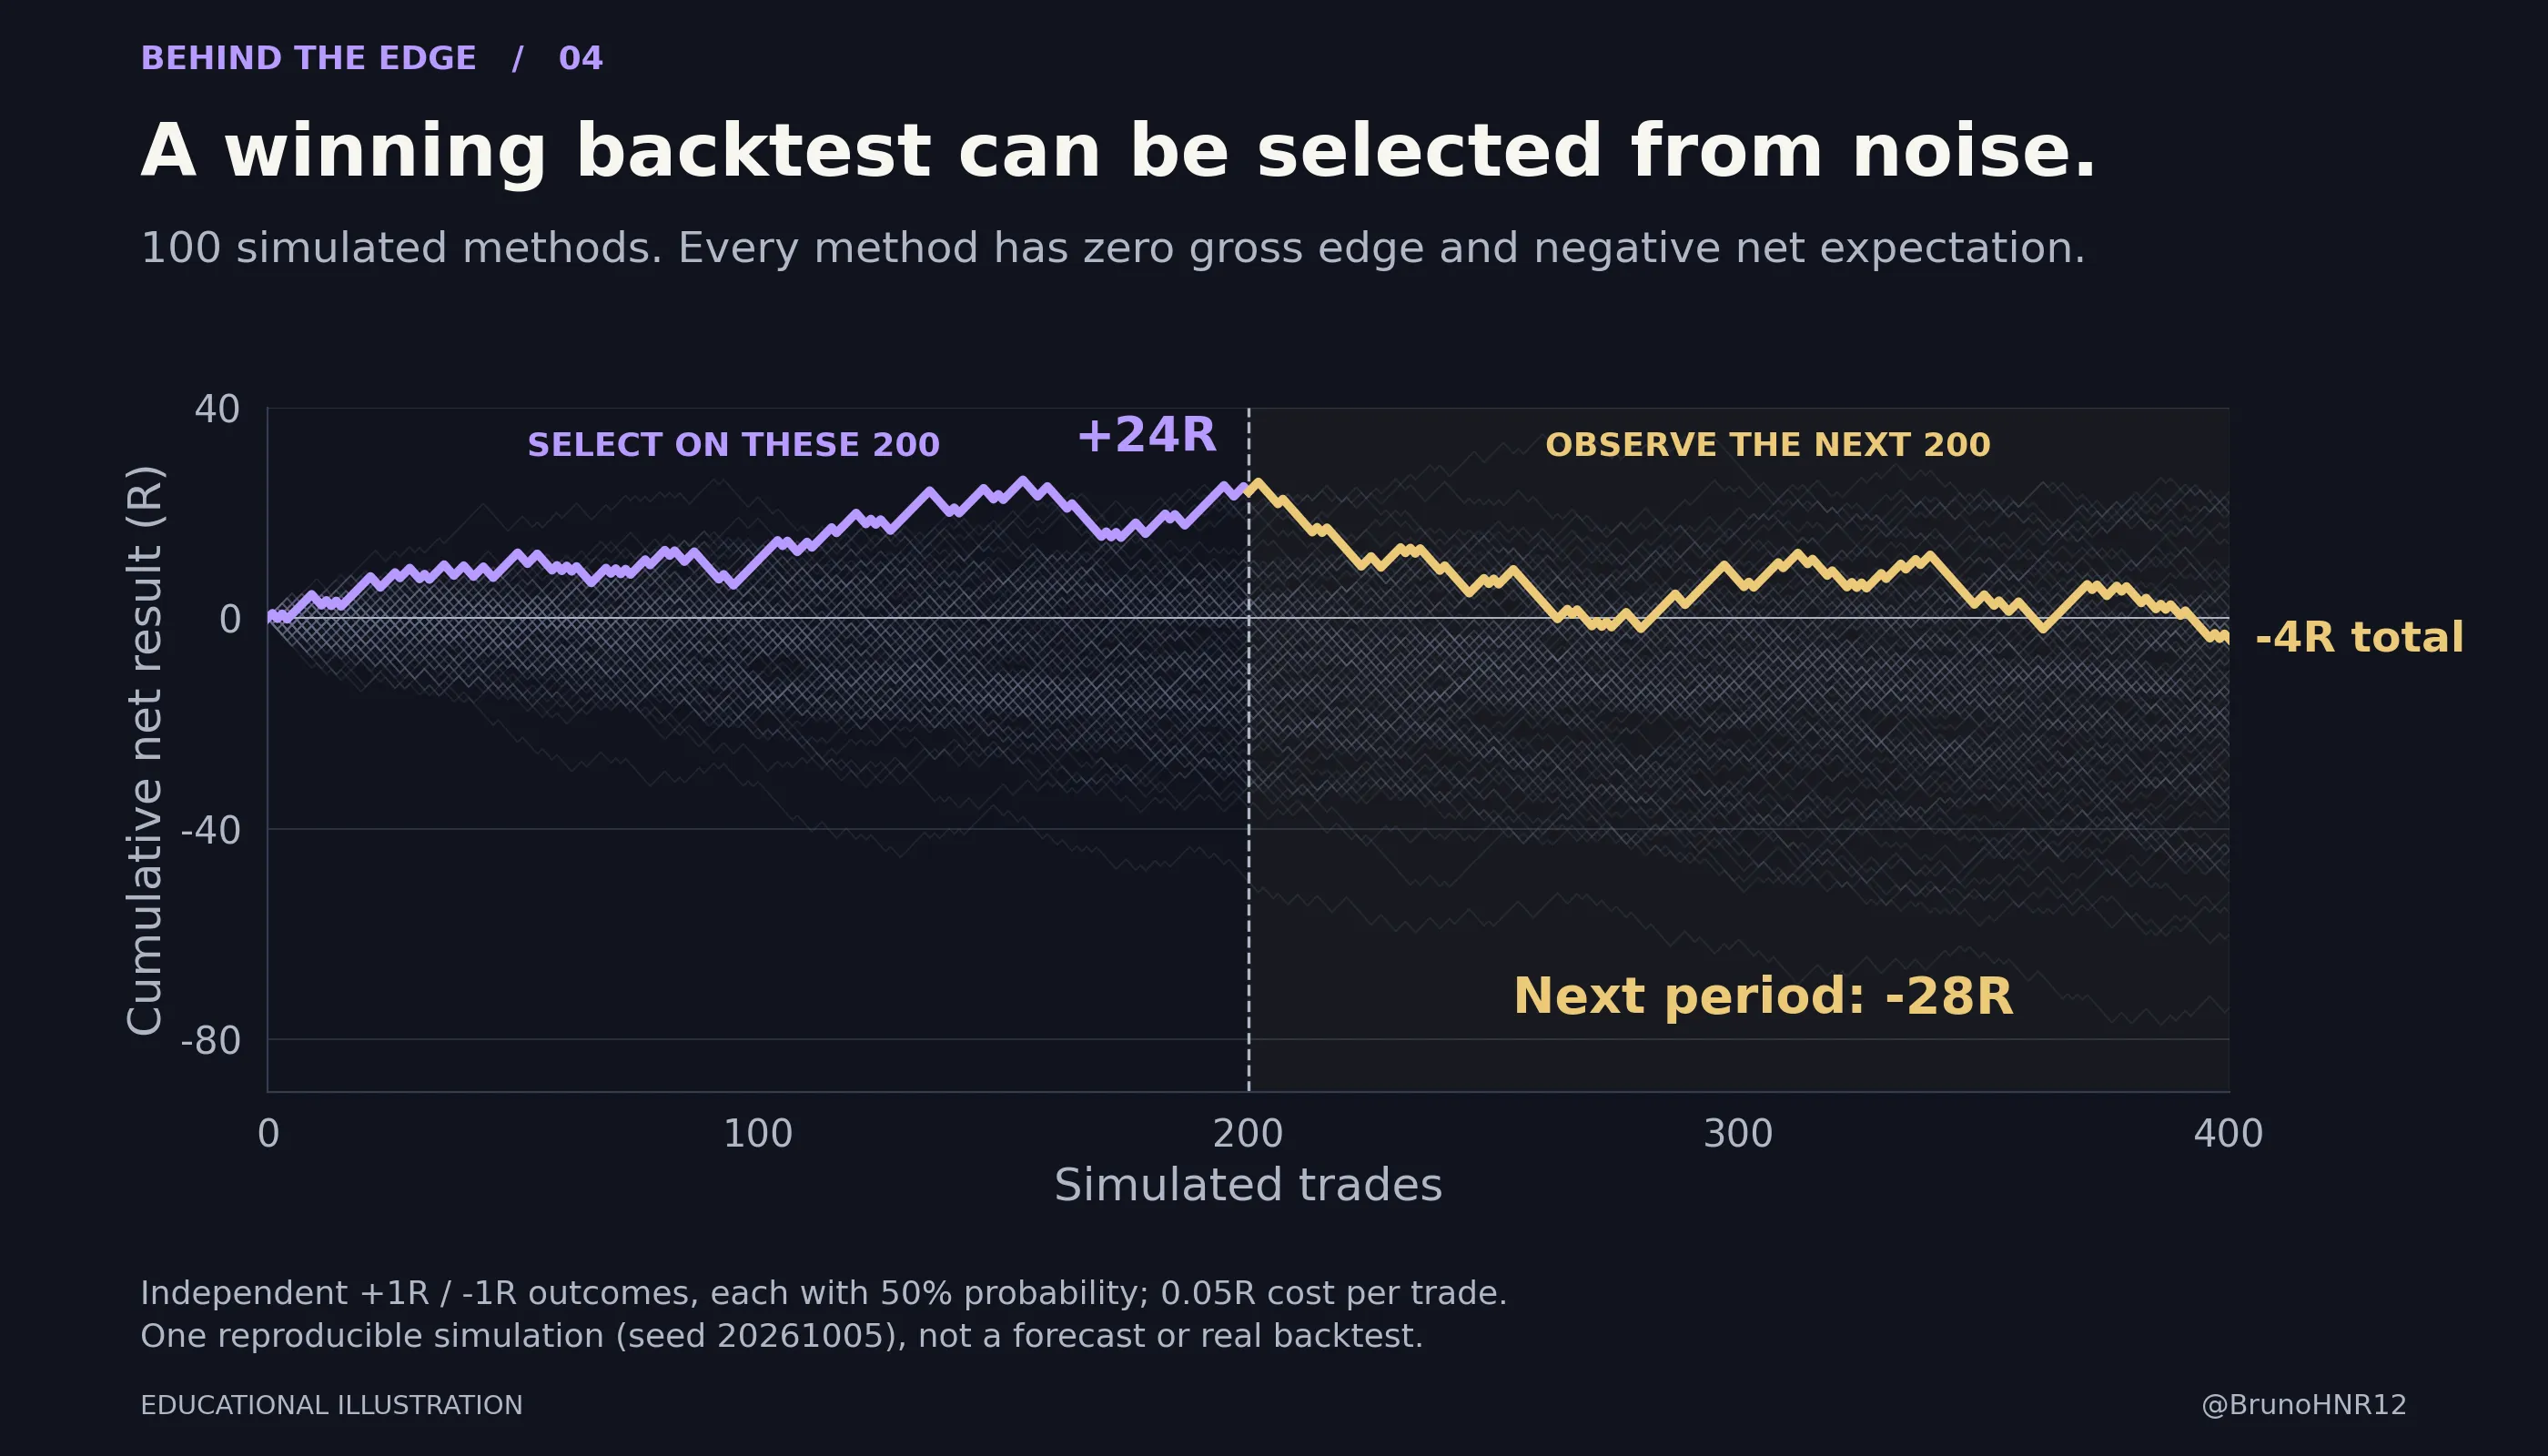
In this reproducible simulation, the selected method earns +24R in the selection period and loses 28R in the next period. No method was given a real advantage. The attractive first segment came from selecting a favorable realization of noise.
This is one generated experiment, not a forecast of how all backtests fail. Another random seed could produce a profitable next segment. That possibility is part of the lesson: even future short samples can be lucky. Real strategy variants are also often correlated, unlike the deliberately independent methods in this simplified model.
The research implication is to record how you arrived at a result. Keep a dated version log, the settings tried, the periods inspected and the reason for each change. A chart chosen from 100 attempts carries different evidential weight from a rule specified before any results were observed.
7 Check whether the backtest could have happened
Key takeaway
Correct arithmetic cannot rescue impossible information or unrealistic fills.
Historical candles summarize price movement. They do not necessarily reveal the order of every trade inside the bar.
Imagine a long position entered at 100 immediately before a bar begins, with a stop at 95 and a target at 105. The next bar opens at 100, reaches a high of 106, a low of 94, and closes at 102.
If price reaches the target first, the position exits with a profit. If it reaches the stop first, it exits with a loss. Both paths can produce exactly the same completed candle.
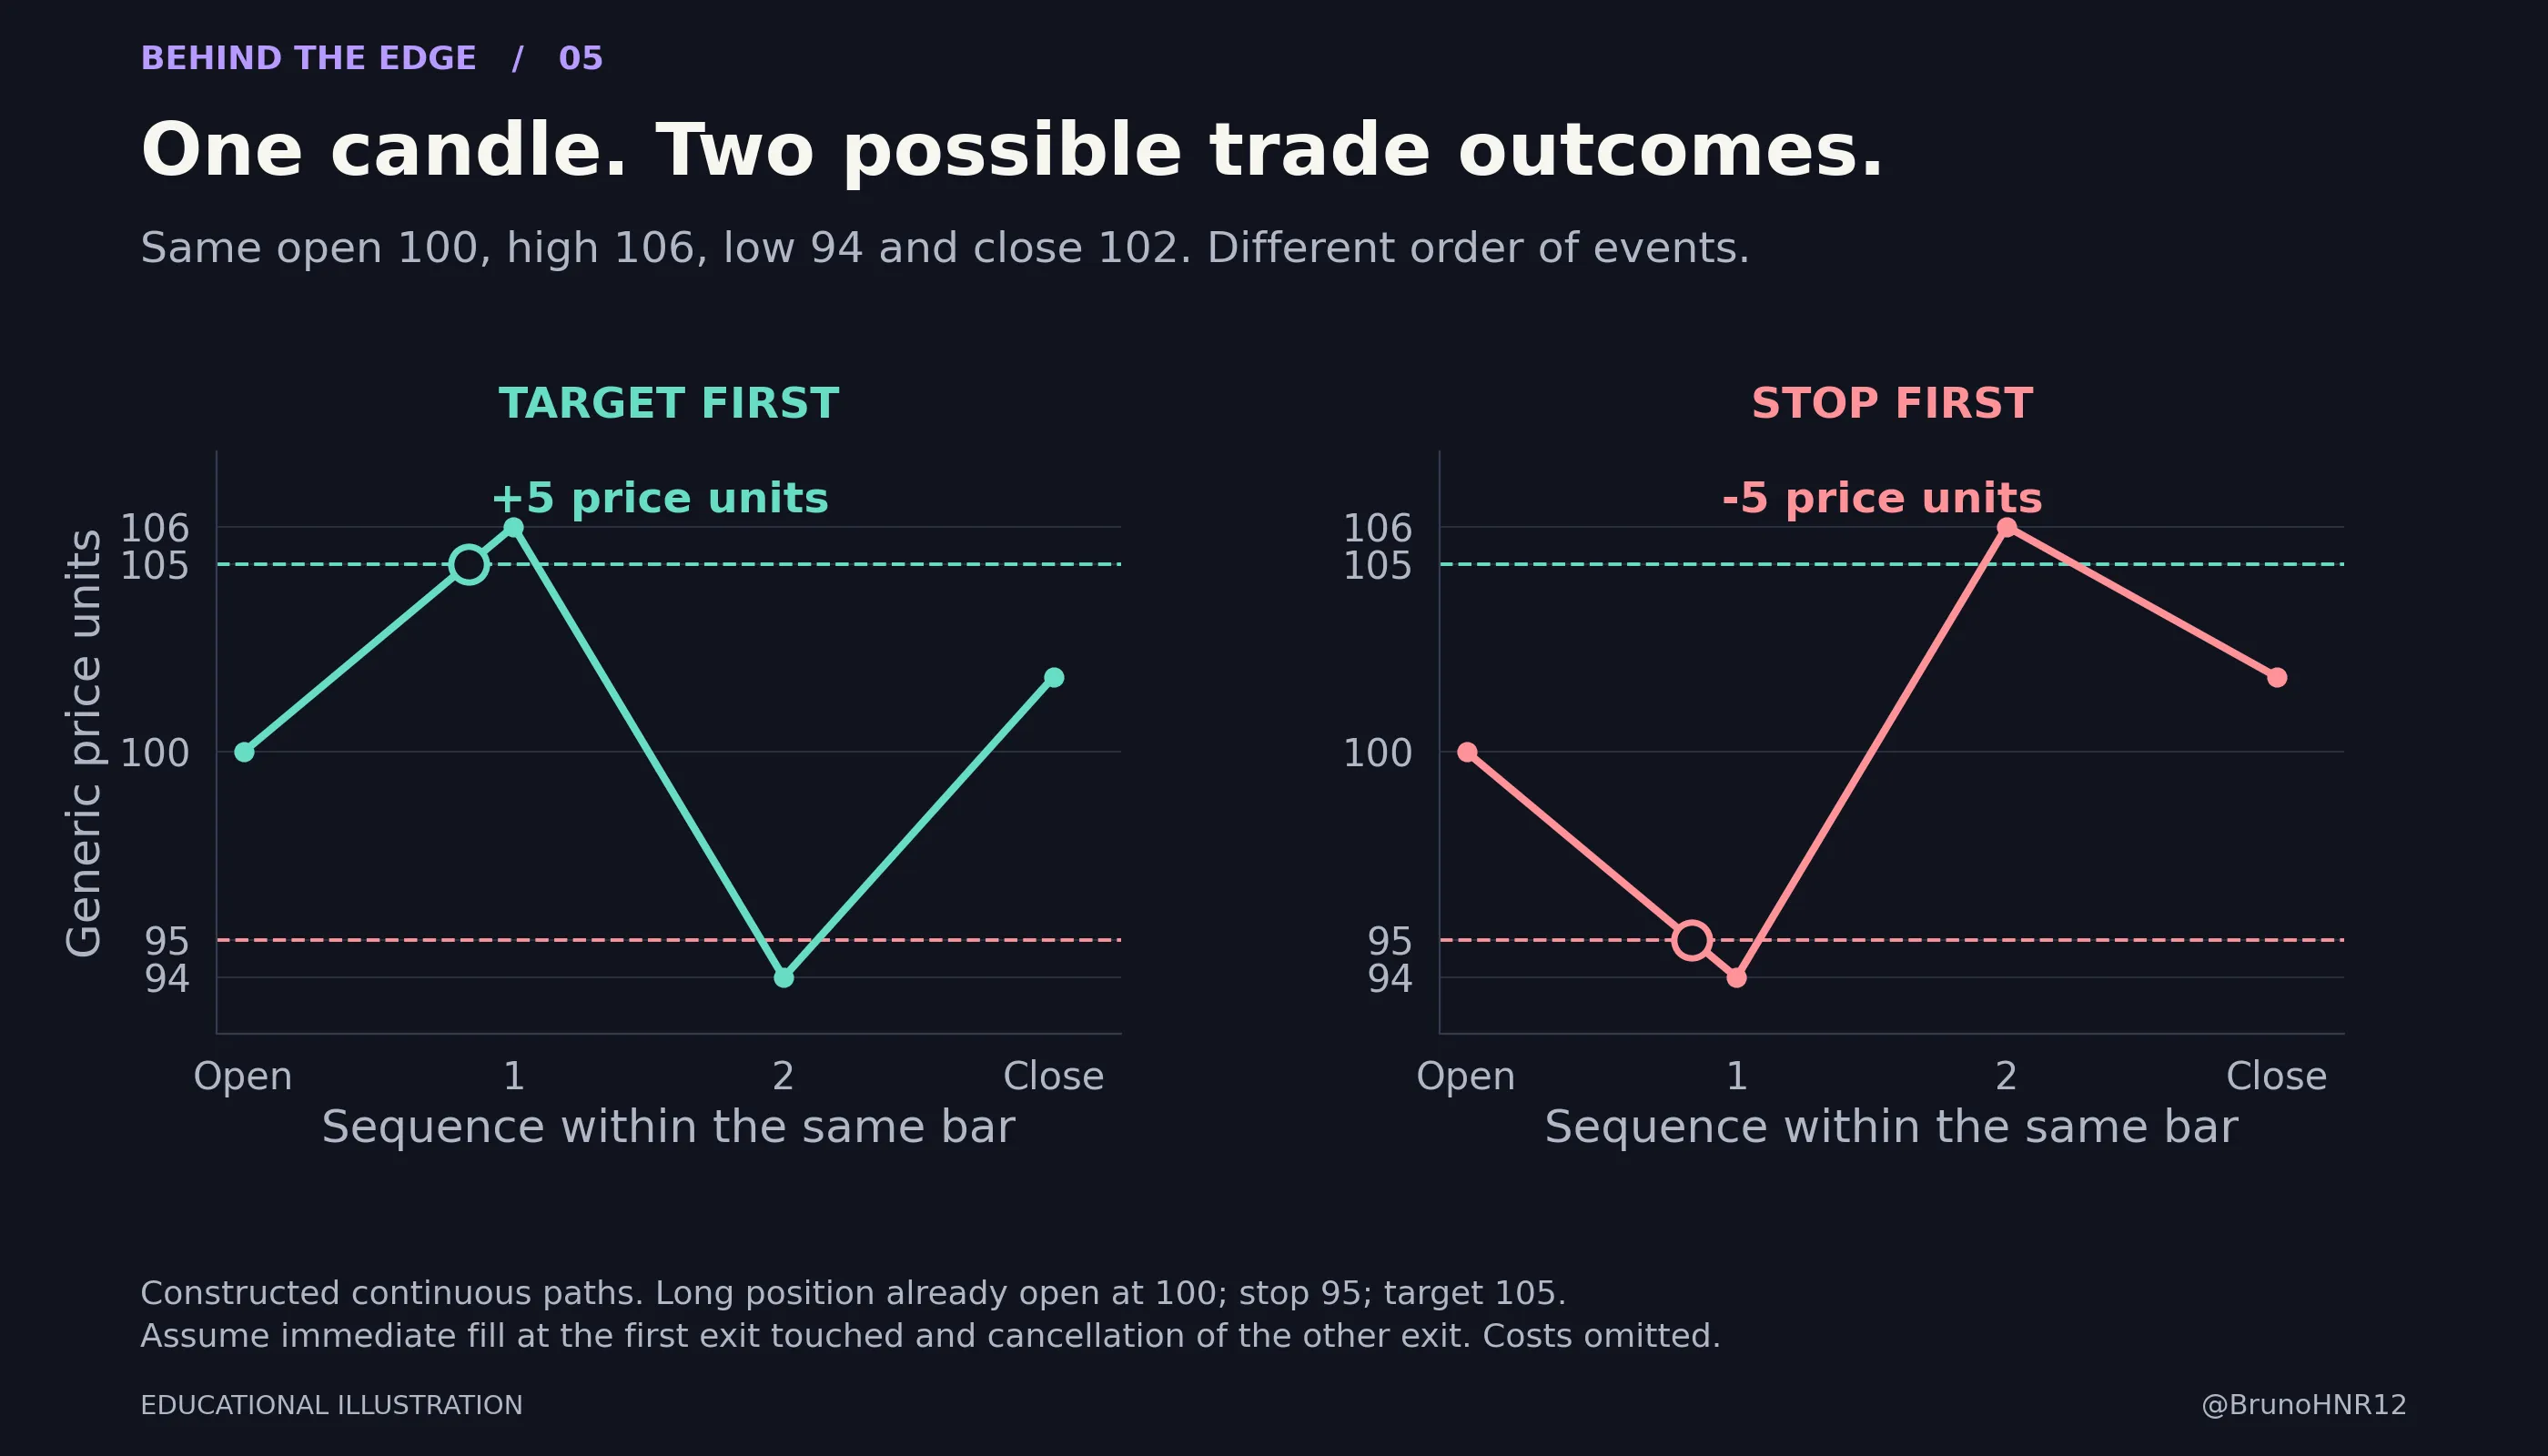
The diagram assumes continuous paths, immediate fills at the first exit level and cancellation of the other exit. It isolates sequencing. Real executions add further uncertainty.
A backtesting engine must resolve this somehow. TradingView, for example, documents its default assumptions about the sequence within a bar and its use of lower-timeframe data when higher historical detail is enabled. More detail can improve sequencing, but it remains a simulation. [8]
For a manual test, mark ambiguous bars instead of choosing the favorable exit. Inspect finer data where available, or report the range of outcomes under explicit assumptions. If the result changes from profitable to unprofitable depending on that choice, the ambiguity is material.
Next, check for lookahead bias, which means using information before it would have been available. Examples include buying before the close on the basis of that final close, or filtering out a losing session because you already know it ended in a range. Historical and real-time calculations must use the same information timing. [8]
For futures, document the actual contract and rollover policy. A continuous chart joins multiple expiries. Back adjustment can shift earlier prices to account for differences between contracts. Sierra Chart explains these adjustments in its official documentation. [9] Do not treat a historical adjusted price level as an actual executable quote without checking the construction.
Also record timezone, session template, missing bars and data granularity. A strategy based on an opening range can change when the definition of “open” changes. A limit price being touched does not establish that your order would have filled in the queue. A test should include a defensible fill rule and sensitivity to worse execution.
NFA identifies hindsight, liquidity and slippage among the limitations of hypothetical performance. Its guidance is a useful reminder that historical simulation and actual trading answer different questions. [10]
8 Test how fragile the result is
Key takeaway
Small plausible changes should be investigated before a single favorable setting becomes a source of confidence.
Suppose a result looks excellent with a 15-minute reference window and a 2R target. What happens with nearby settings? What happens if execution is slightly worse or the best session is missed?
Figure 6 shows two deliberately constructed performance surfaces. Each cell is a hypothetical average net R per trade for one pair of settings. The left surface remains positive across the neighboring choices. The right contains one exceptional result surrounded by weak results.
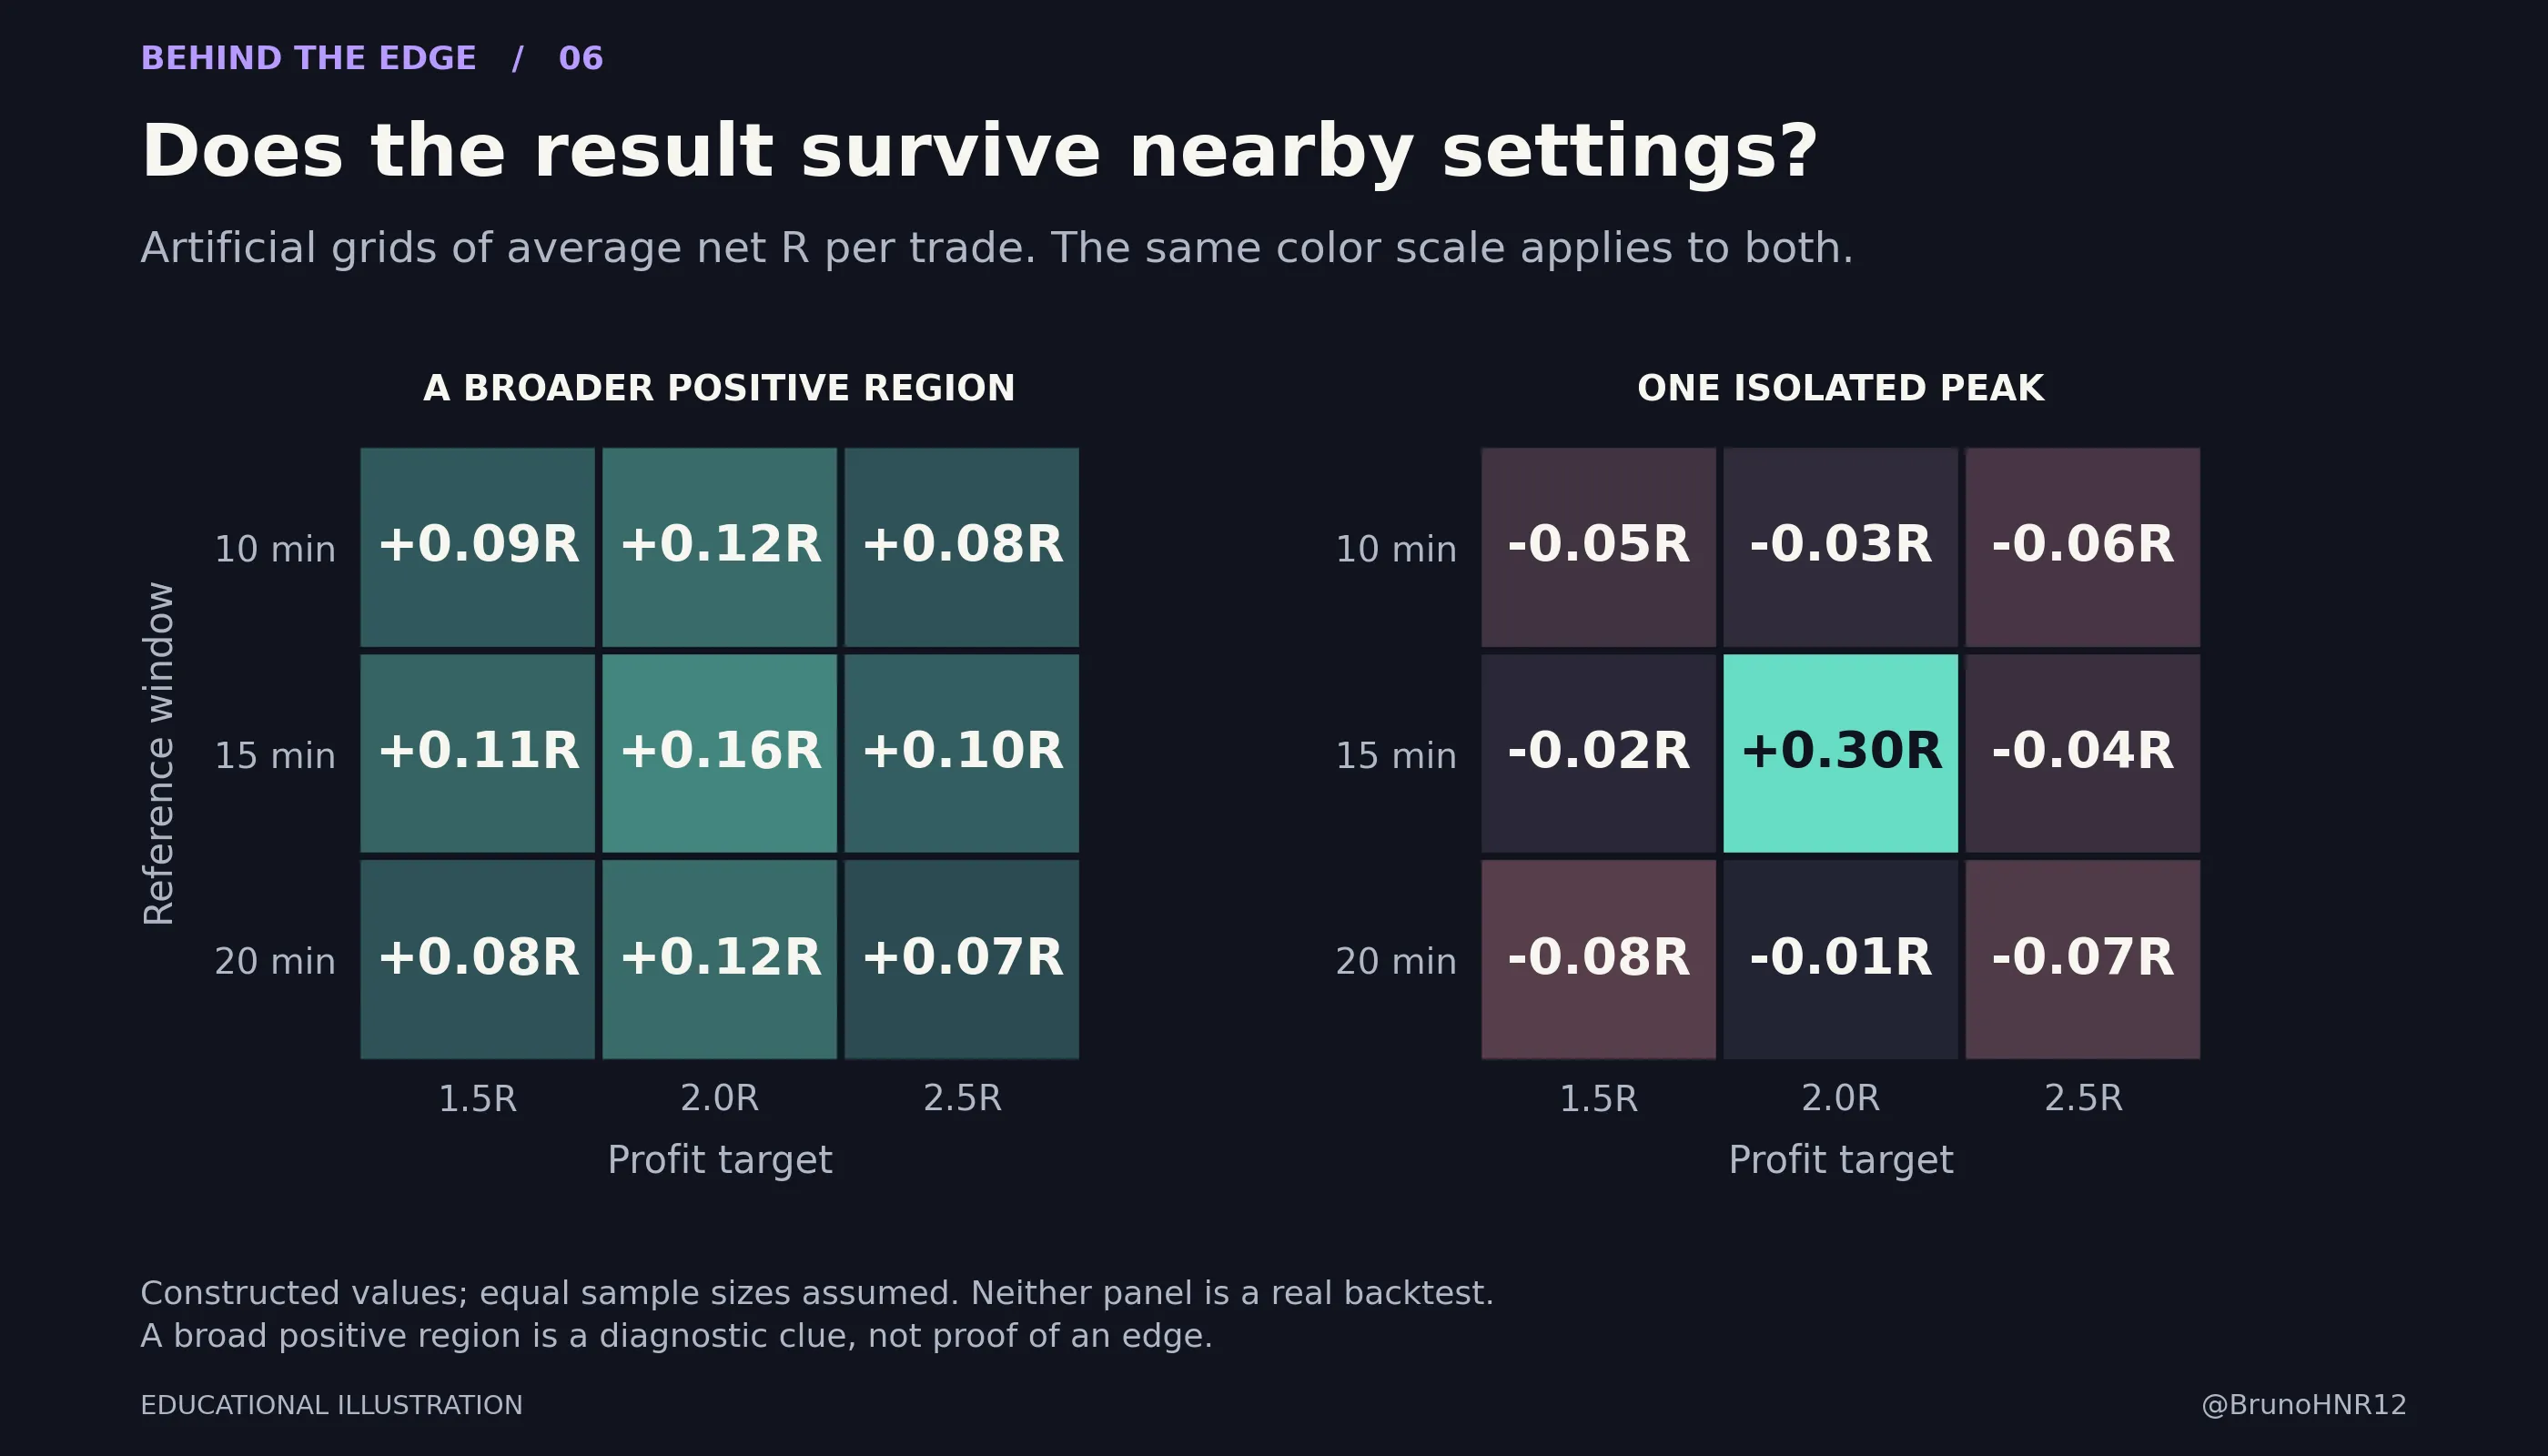
A broader positive neighborhood gives you a reason to investigate stability. An isolated peak gives you a reason to investigate fragility. Neither establishes an edge, and some economically meaningful rules can have genuine thresholds. The grid is a diagnostic, not a pass certificate.
Keep the number of variations limited and explain their purpose. Repeatedly exploring grids until you find an attractive one recreates the selection problem in Section 6.
Useful checks include a higher plausible cost assumption, a modest execution delay, missed fills and a change in a nearby parameter. Preserve the original result alongside each changed assumption. If skipping a few legitimate trades destroys the outcome, examine whether your schedule and discipline can realistically support the method.
Stress checks should reflect a concrete concern. There is no value in inventing hundreds of arbitrary scenarios just to choose the ones your strategy survives. A history of extreme slippage during a particular event, for example, is a better reason to test worse fills than a desire to make the spreadsheet look rigorous.
9 Build a test that preserves new information
Key takeaway
Decide the rules and evaluation process before seeing the next results. Reusing a test to make improvements consumes its independence.
Separate development from evaluation in time. That does not create certainty, but it makes the evidence easier to interpret.
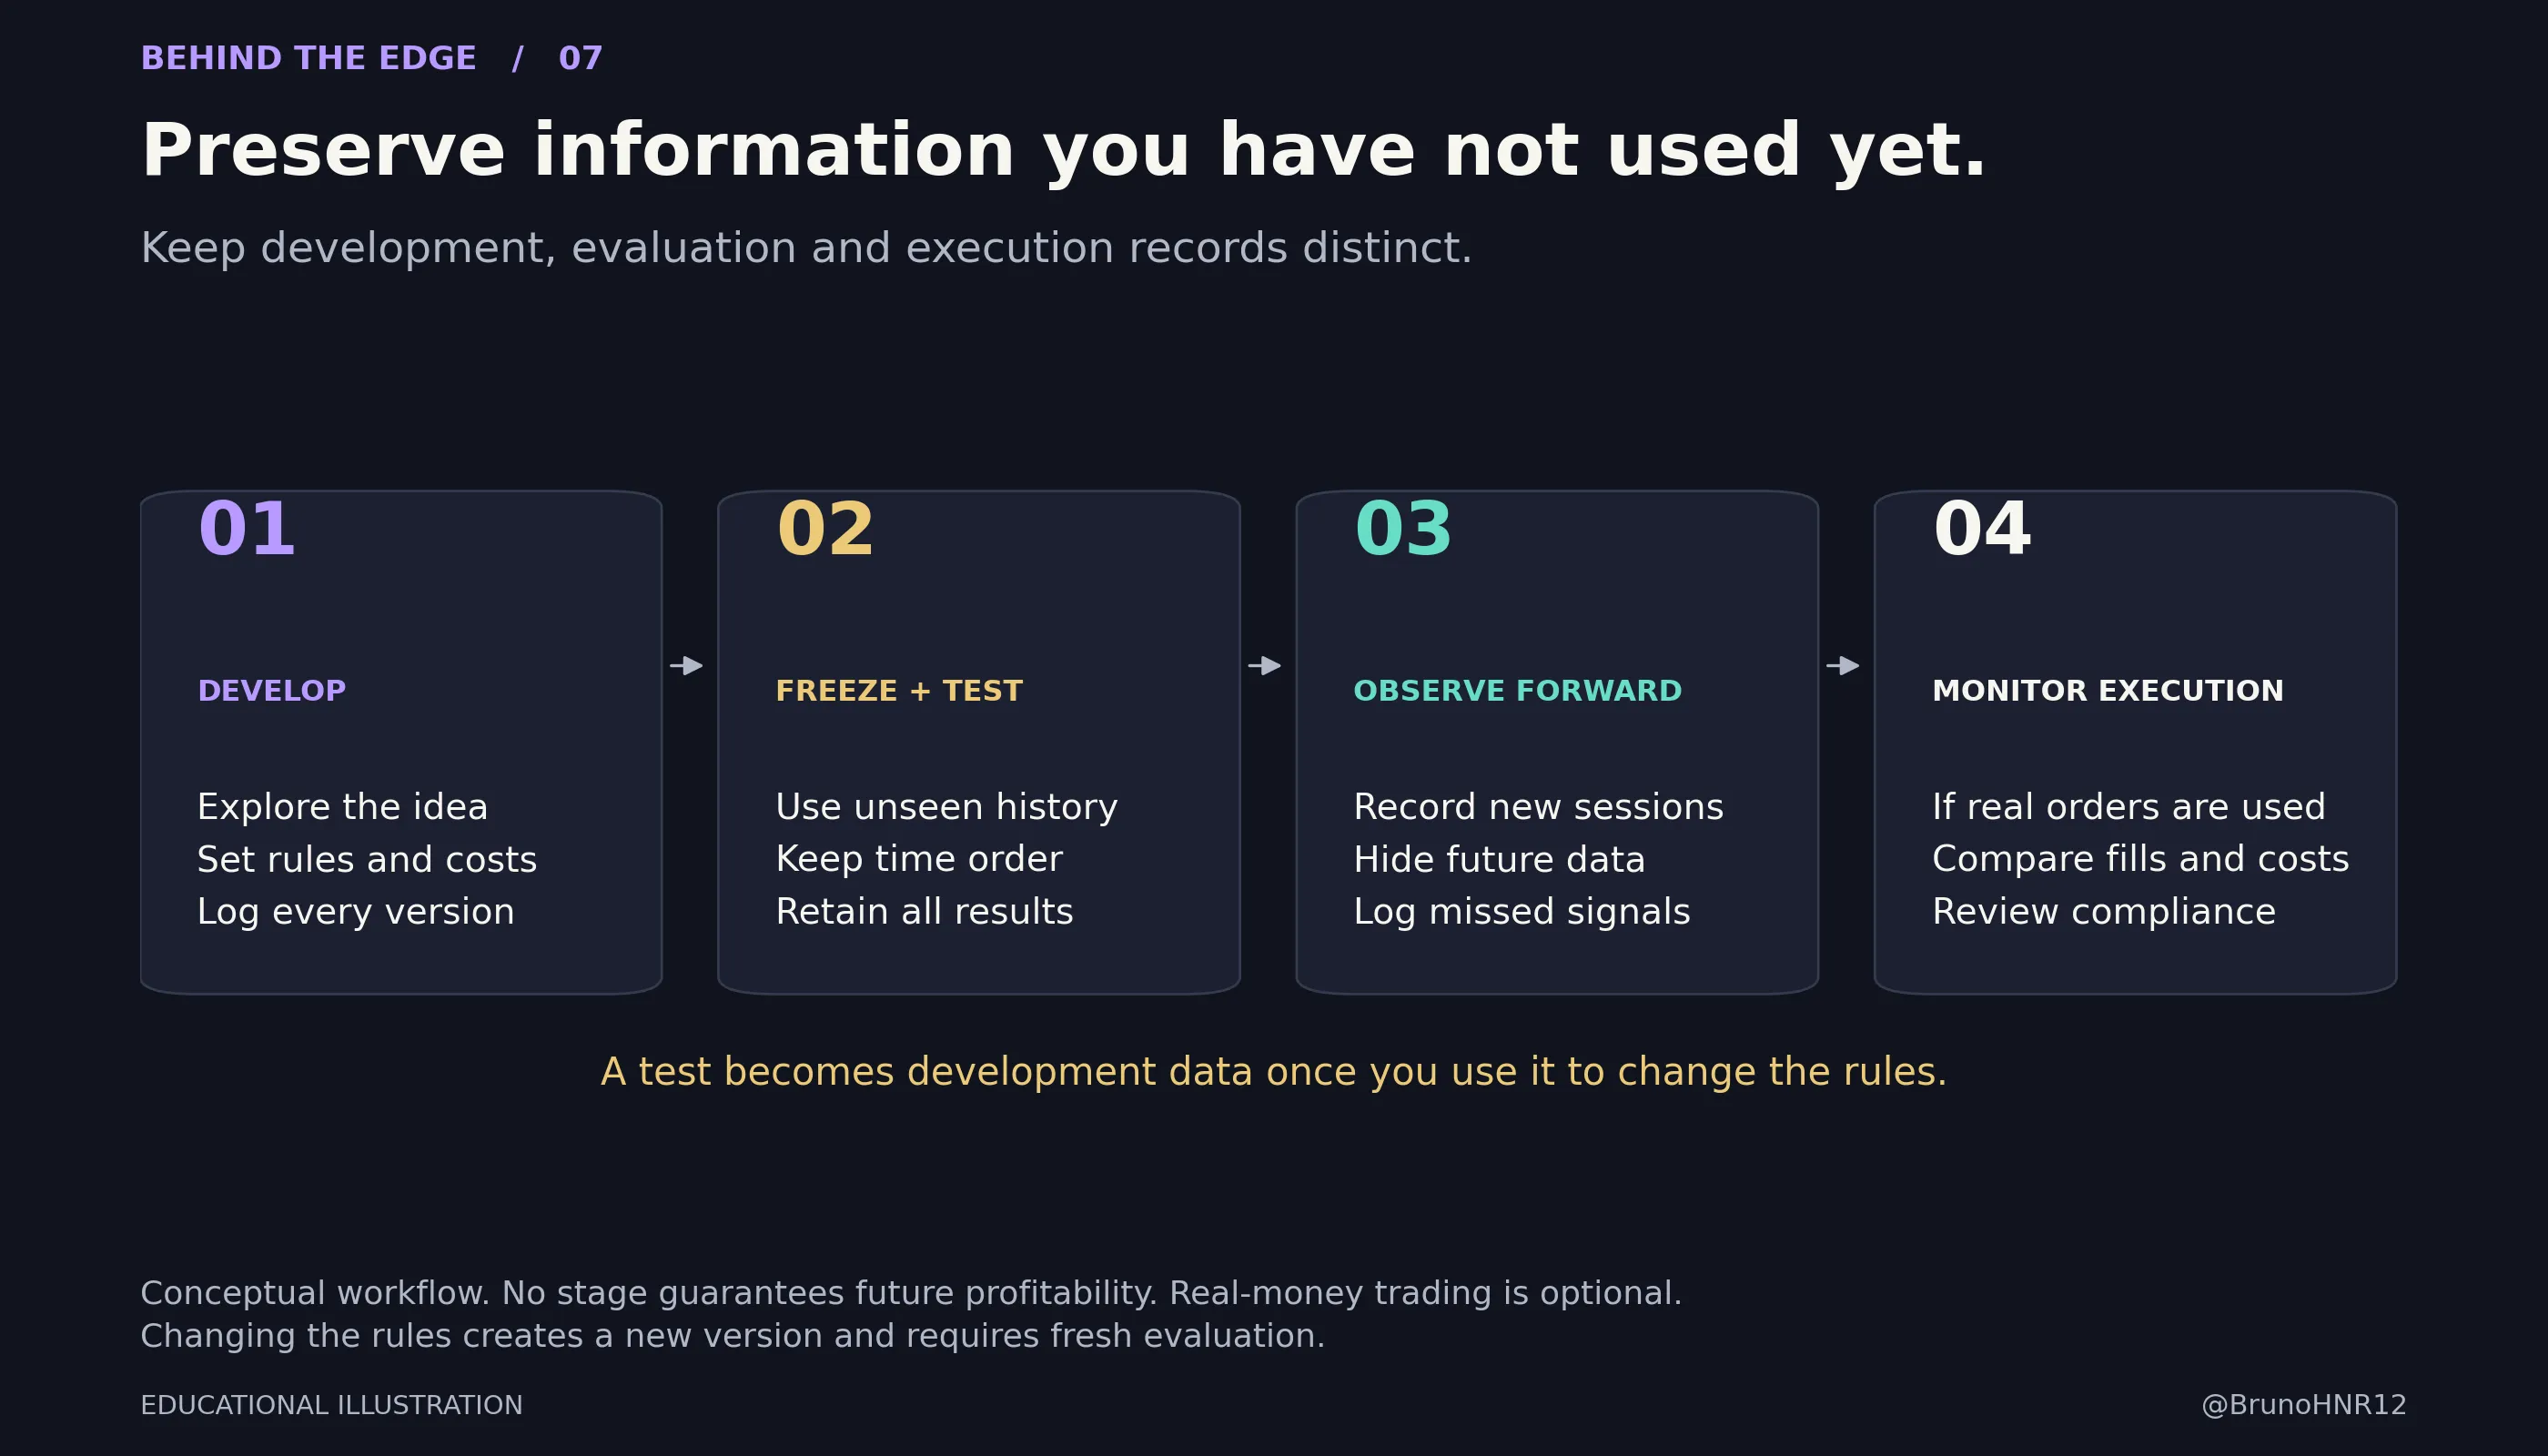
Development. Explore an idea, define the rules, correct errors and estimate realistic costs. Label these results as development results. Record alternatives and rejected versions.
Historical evaluation. Apply the frozen version to a later period that was not used to design it. Decide the date range and success or failure criteria in advance. Chronological separation is useful for a method intended to operate in future sessions, though one period can still be unrepresentative.
Prospective simulation. Record decisions as new market data arrives, with future bars unavailable. Save missed opportunities, rejected signals and actual decision times. This helps test whether the method can be recognized and followed without hindsight.
Execution monitoring. If the method is ever used with real orders, compare observed fills, fees, missed trades and behavior with the assumptions. Keep simulation and actual execution records separate. This stage is a further source of evidence, not a requirement to risk money to finish the exercise.
The crucial rule is what happens after a disappointing test. If you inspect the losing trades and modify the strategy, that is legitimate development of a new version. The same period can no longer serve as untouched evidence for that version.
An out-of-sample label is therefore not enough by itself. Bailey and colleagues discuss limitations of simple holdouts, including selection across many attempts and the difficulty of maintaining genuine separation. More sophisticated validation requires attention to the full research process. [7]
For a beginner, the practical improvement is modest but valuable: write the plan, freeze a version, preserve chronology, record every attempted variant and let genuinely new sessions accumulate.
Predetermine review dates and minimum observations rather than ending a test at its first attractive peak. If formal statistical significance is used, repeated checking needs an appropriate sequential-testing design; ordinary fixed-sample thresholds cannot simply be reused until they approve the strategy. Research on continuously monitored experiments explains this distinction. [11]
An operational safety limit is different. A data failure, order-routing problem or predetermined loss limit can justify stopping activity immediately. Record the stop and retain the incomplete test. Do not relabel it as a completed success or hide it from the research history.
10 Separate the method from your execution
Key takeaway
Keep two records: what happened financially and whether the decision followed the specified process.
Consider four trades. One follows the plan and wins. One follows the plan and loses. One breaks the rules and wins. One breaks the rules and loses.
The account statement sorts them by money. A useful review also sorts them by process.
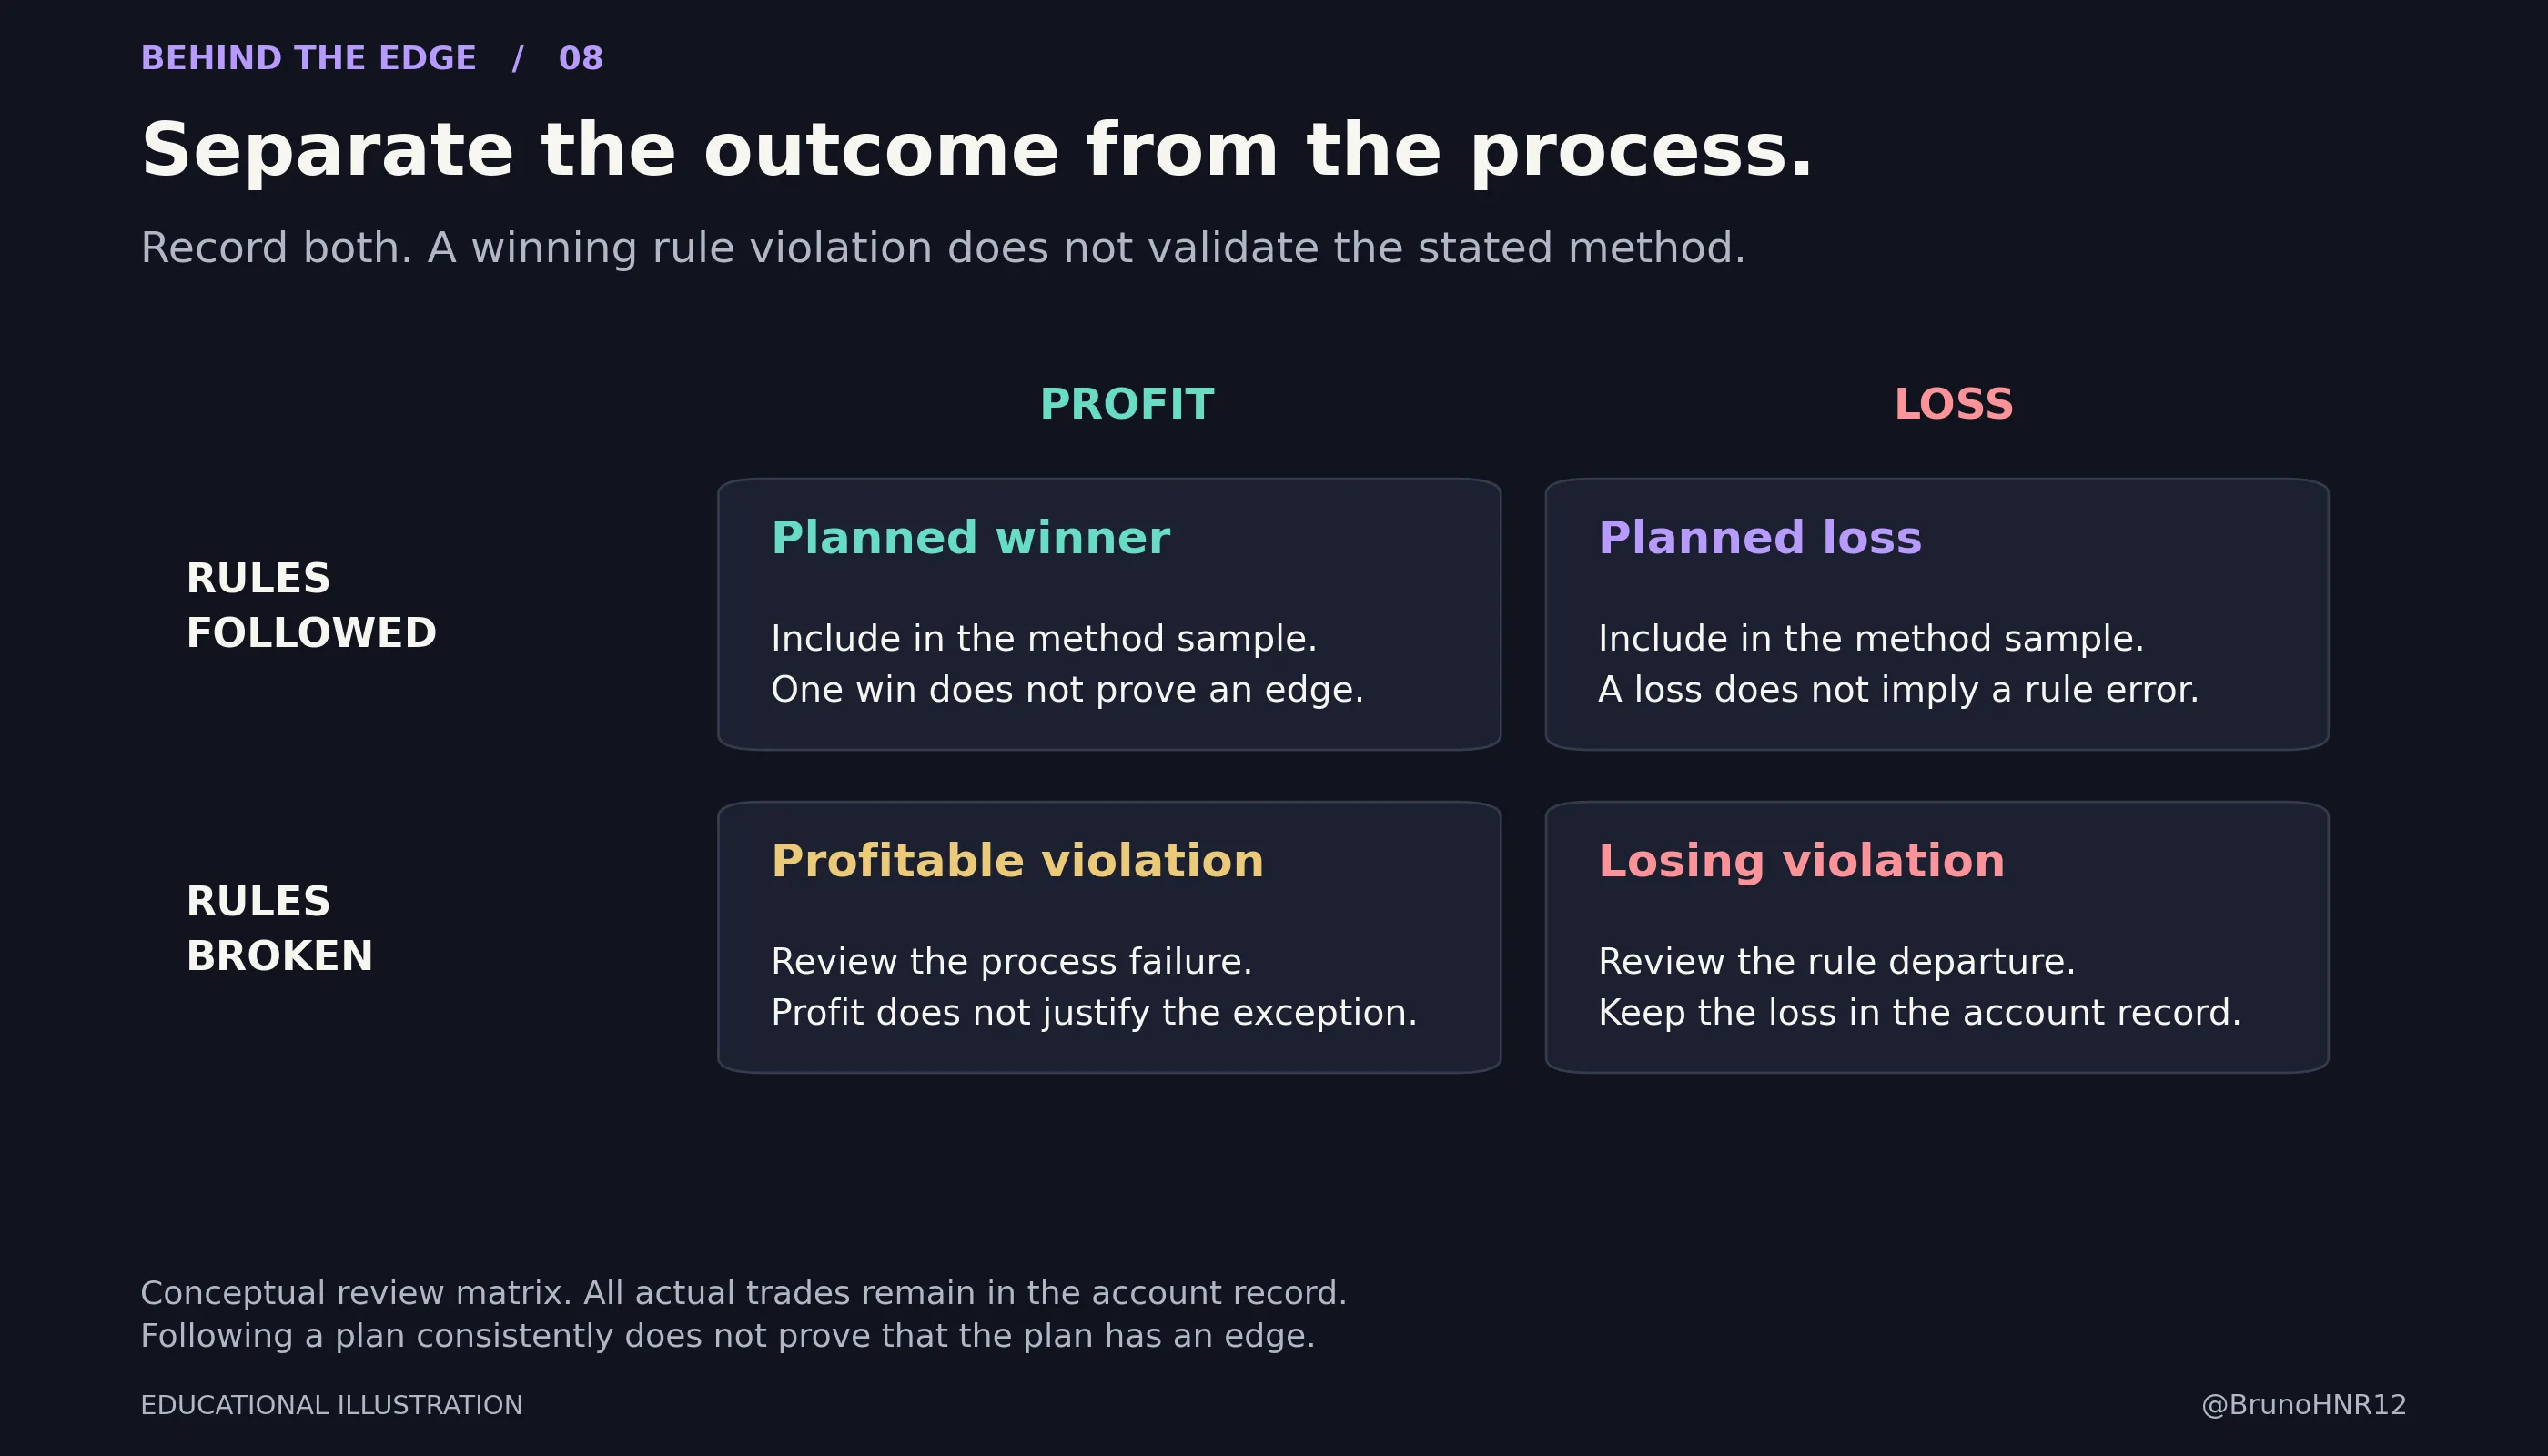
A compliant loss belongs in the method's evidence. Removing it because it “should have worked” distorts the sample. A profitable violation belongs in the account's actual result, but it does not support the performance of the rule set you claim to be testing.
Compliance itself does not prove good judgment or a profitable method. A trader can execute an unprofitable system perfectly. The two records help identify the question that needs attention: do the rules lack support, or did the realized behavior differ from the rules?
A practical journal should preserve the setup version, timestamp and contract; the information and reason for entry; planned and actual prices; initial R and size changes; explicit fees; net R and dollars; compliance status; and screenshots captured at the decision time. Add a specific reason for skipped eligible signals and trades taken outside the rules.
Then compare the model and execution using a consistent definition. For example, a prospective model might record +12R across its eligible opportunities while the actual account records +3R. That gap is a prompt to reconcile missed signals, extra trades, different exits and fill differences. It is not automatically proof of poor discipline; the model's fill assumptions may also be wrong.
Keep both totals. Reporting only compliant actual trades may help diagnose a method, but it does not describe the account's full experience. Reporting only the ideal model conceals whether the trader can realistically execute it.
11 Decide what the evidence supports today
Key takeaway
A useful review ends with a specific status and a reason. It does not need to end with a declaration of certainty.
Build a compact review sheet. Include the strategy version and rules, testing dates, number of trades and sessions, data source, cost model, net results, distribution of outcomes, drawdown, concentration in major winners, and differences between model and execution. State whether each period was used for development, untouched historical evaluation or prospective observation.
Use a few clear statuses:
- Not evaluable: The rules, data or execution assumptions are too unclear to interpret the result. Fix the record before judging the method.
- Not supported by this test: The result fails the criteria chosen beforehand. Preserve it and explain what failed.
- Promising but uncertain: The net observations are encouraging, while the sample, condition coverage or sensitivity leaves material questions open.
- Supported within the tested scope: Several relevant checks and new observations support the current version. Specify the conditions and keep monitoring; this is not a permanent guarantee.
What should the criteria be? They depend on the claim. A basic feasibility test might ask whether conservative costs erase the average result, whether the method relies on impossible fills and whether a later period contradicts the development result. A formal claim of a positive expected net return needs an uncertainty analysis suited to the observations, dependence and selection process.
Do not replace that work with a universal profit-factor threshold, a required win rate or a fixed trade count. Profit factor, for example, divides accumulated winning amounts by the magnitude of accumulated losing amounts. It describes a sample, can be inflated by a few trades and becomes unstable when there are very few losses.
Review changes in market conditions and execution too. If costs rise or the original setup becomes rare, the relevant question is whether the current method still fits its stated scope. Quietly redefining the setup to protect a favorable history prevents that comparison.
The same discipline applies to someone else's results. Ask for the rules, net costs, sample dates, actual versus hypothetical status, versions tried and genuinely new evidence. An impressive screenshot leaves most of those questions unanswered.
A final check before you trust the curve
Can you explain which version produced the result, how the decisions were made without future information, and how much remained after costs?
Can you identify the conditions that contributed most, the assumptions the result depends on, and the evidence that was collected after the rules were fixed?
Can you distinguish a weak method from a method you did not execute as specified?
Those answers make a profitable period more informative. They also make a losing period more useful. The objective is to build confidence that stays proportionate to the evidence.
Which part of your strategy have you actually tested, and which part are you still taking on trust?
Sources and chart methodology
Sources checked on 5 October 2026. Foundational research is identified by its original publication date. The examples are original educational constructions, not reproductions of the performance of any cited source.
[1] CME Group. The Mathematics of Trading Success. Mathematical expectation and the relationship between outcome frequency and payoff size. Read source ↗
[2] CME Group. Micro E-mini Nasdaq-100 Index Futures Contract Specifications. $2 per index point and a 0.25-point minimum increment. Read source ↗
[3] NIST/SEMATECH e-Handbook of Statistical Methods. Confidence intervals for a binomial proportion. Method used for Figure 2. Read source ↗
[4] NIST/SEMATECH e-Handbook of Statistical Methods. What are confidence intervals. Interpretation of repeated-sampling coverage. Read source ↗
[5] NIST/SEMATECH e-Handbook of Statistical Methods. Autocorrelation Plot. Dependence and the assumptions behind common statistical formulas. Read source ↗
[6] Bailey, Borwein, López de Prado and Zhu. Pseudo-Mathematics and Financial Charlatanism: The Effects of Backtest Overfitting on Out-of-Sample Performance. 2014. Read source ↗
[7] Bailey, Borwein, López de Prado and Zhu. The Probability of Backtest Overfitting. Author manuscript revised February 2015. Read source ↗
[8] TradingView. Pine Script documentation, Strategies. Broker emulator, historical detail, lookahead bias and strategy testing. Platform-specific behavior should be rechecked when implementing a test. Read source ↗
[9] Sierra Chart. Continuous Futures Contract Charts. Construction and interpretation of back-adjusted historical prices. Read source ↗
[10] National Futures Association. Interpretive Notice 9025. Limitations of hypothetical performance, including hindsight, liquidity and slippage. Read source ↗
[11] Johari, Koomen, Pekelis and Walsh. Always Valid Inference: Continuous Monitoring of A/B Tests. Published online in 2021; Operations Research 70(3), 2022. Statistical background on repeated monitoring, not a validation study of futures trading. Read source ↗
Figure 1 uses a constructed set of 54 +1R outcomes and 46 -1R outcomes, shuffled with NumPy PCG64 seed 20261006. A flat 0.10R is deducted per completed trade. There is no compounding or changing position size.
Figure 2 uses two-sided Wilson score intervals with z = 1.959963984540054 and counts of 12/20, 60/100 and 300/500. The constant-probability, independent-outcome model is an illustration of sampling uncertainty, not a model of actual trading performance.
Figure 3 is a constructed contribution example: +20R from three trades and -5R from the remaining 97, already net of assumed costs. Figures 5 and 6 are constructed paths and parameter values. They are not historical observations.
Figure 4 uses NumPy PCG64 seed 20261005. An array of 100 by 400 independent outcomes is drawn from {-1R, +1R} with equal probability; 0.05R is deducted per trade. The method with the highest cumulative net result at trade 200 is selected, breaking ties by first array position. Its next 200 outcomes are not used in the selection. Curves show cumulative R without compounding. The simulation illustrates selection bias; it is not a reproduction of the formal PBO estimator in reference 7.
Figures 7 and 8 are conceptual diagrams. All charts use original calculations or constructions described above. The accompanying chart files and reproduction script retain these assumptions.
Turn your observations into clearer decisions.
You know your rules, but struggle to follow them during a session? Individual coaching focuses on your performance, decisions and the obstacles you face. Sessions are available in French or English; English is not my native language.